With valid credentials and at least one explorable network available, you can start your first discovery run. In general, during discovery, the runner scans your managed environment for devices, databases and networks, collects this data, transforms and finally displays it in standardized list views. Thus, discovery always sets the framework for inventory jobs which depend on this data framework being available and structured. There are several ways to start a discovery run, e.g. via an automated device schedule Devices (see chapter Devices for details).
There are many possibilities to discover your managed environment, depending on the way it is structured. If you rely on Unix-like and other special devices in your environment, it is recommended to discover your IT landscape via the Ping Sweeper scanning method.
Here is how to perform an one-time network scan using the credentials and network definitions we added previously.
|
Note: |
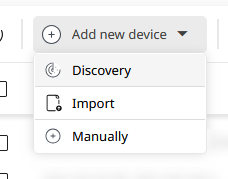
1.Navigate to the Devices view in the Asset Management workspace. Afterwards, click on Add new device and select Discovery to open the Device discovery wizard.
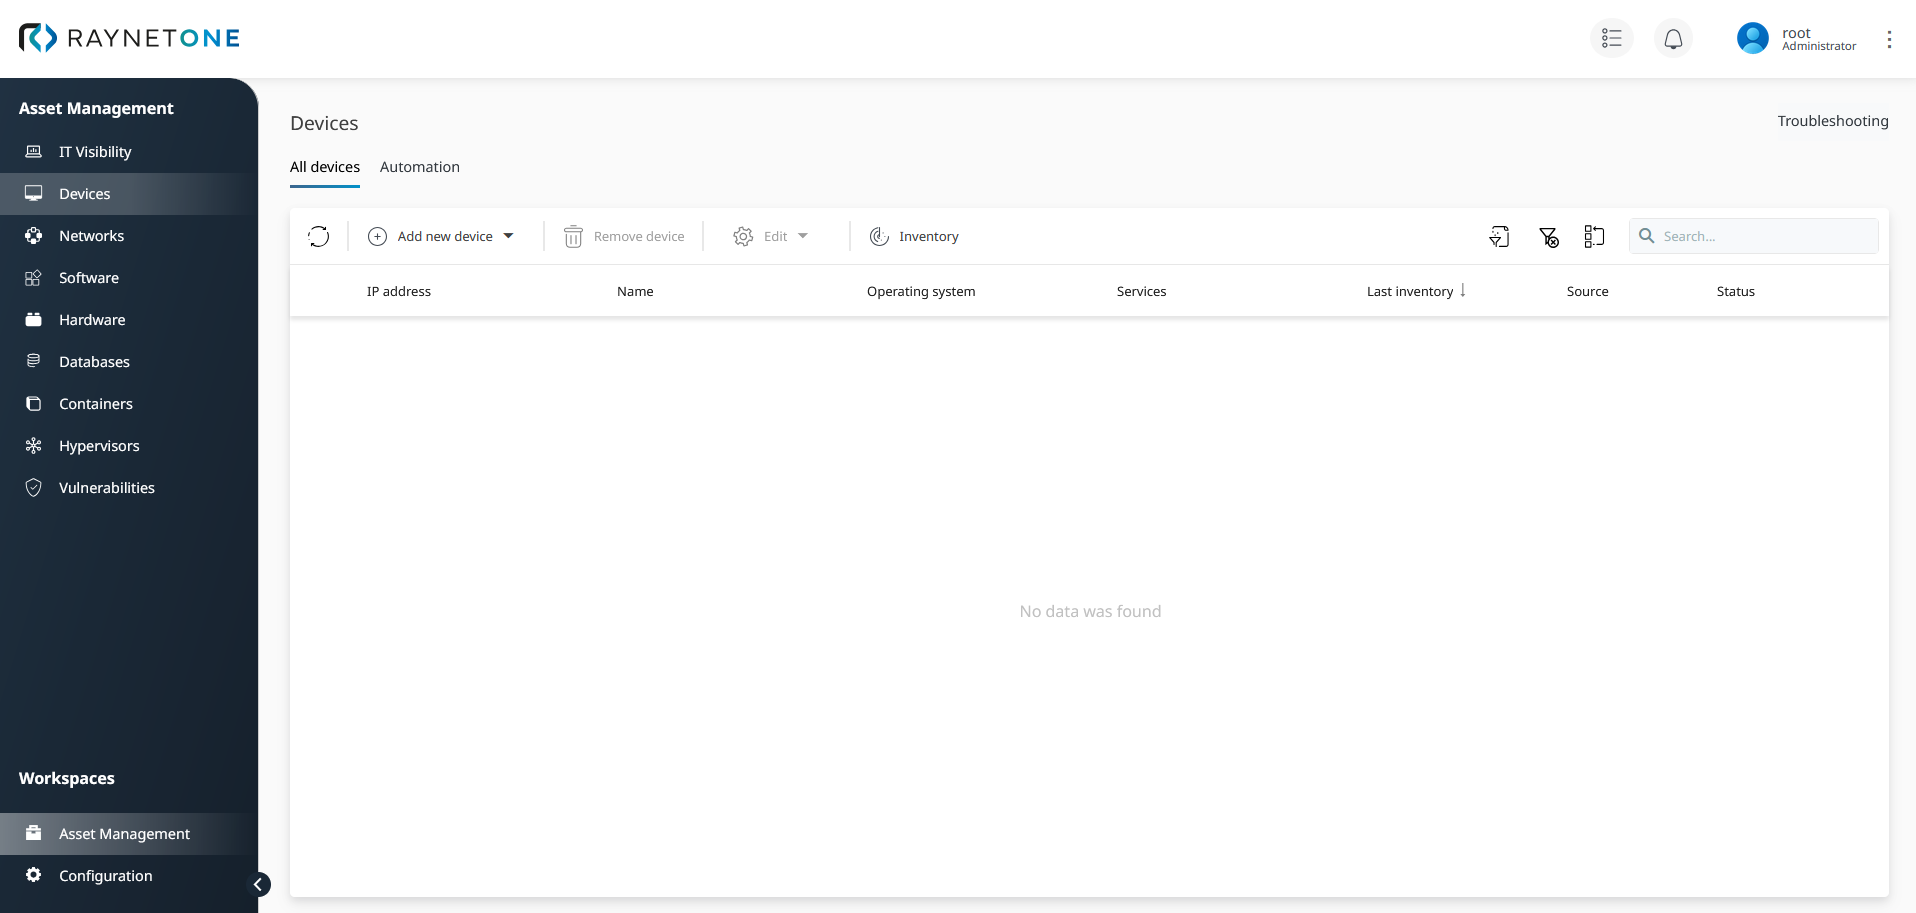
If you start off with a fresh platform and have skipped the SSP experience, you may find an empty devices list as shown above. Populate this list with active, evidence-based network devices by following the steps of this chapter!
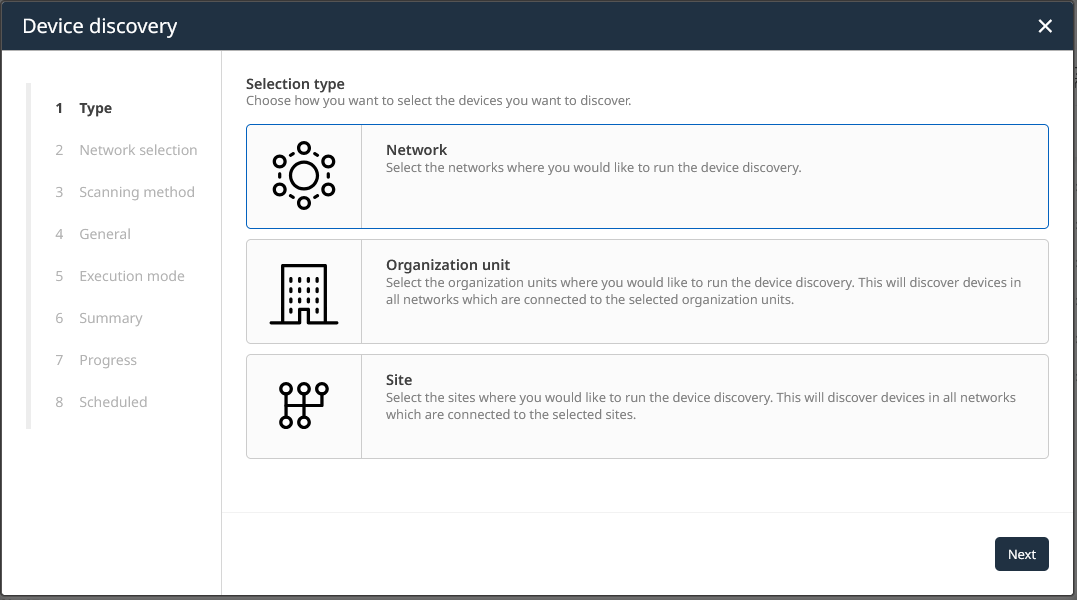
2.Under the Type step, select the Network option. It should be selected by default. Click on Next to proceed.
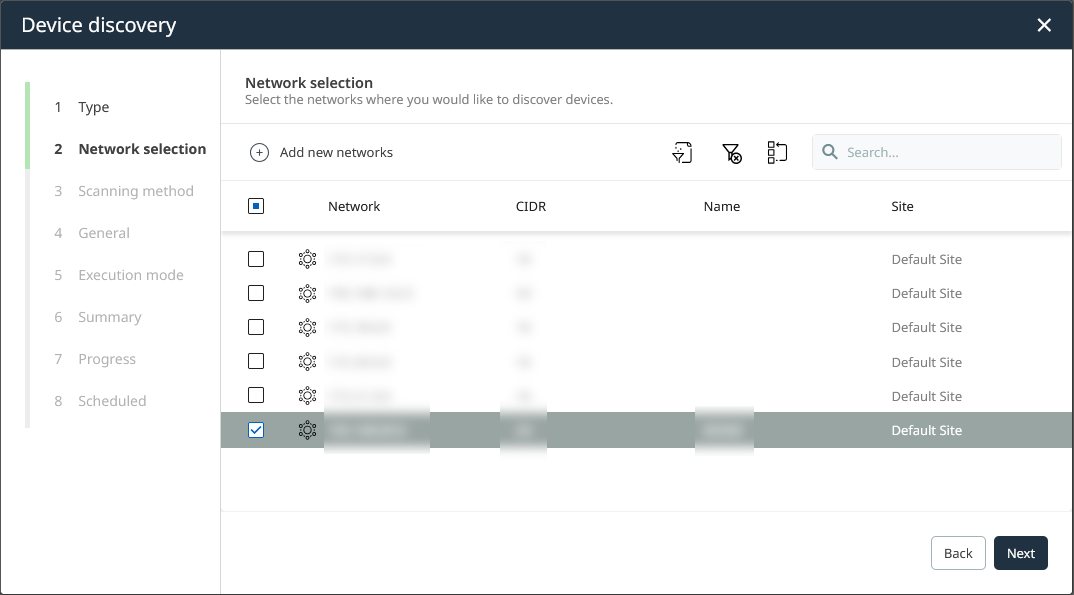
3.Specify the networks to scan. Select the ones we have previously added in the Add a new network chapter. Unselected networks will not be scanned as part of the discovery run.
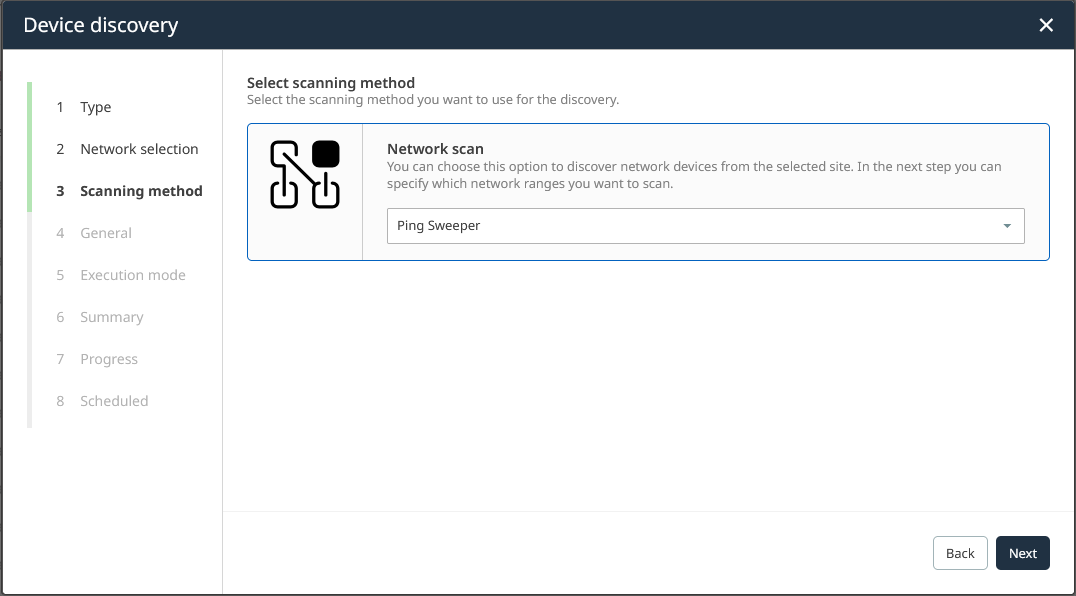
4.Select Ping Sweeper as the scanning method inside of the Network scan section. The option should be selected by default. Then click on Next to proceed.
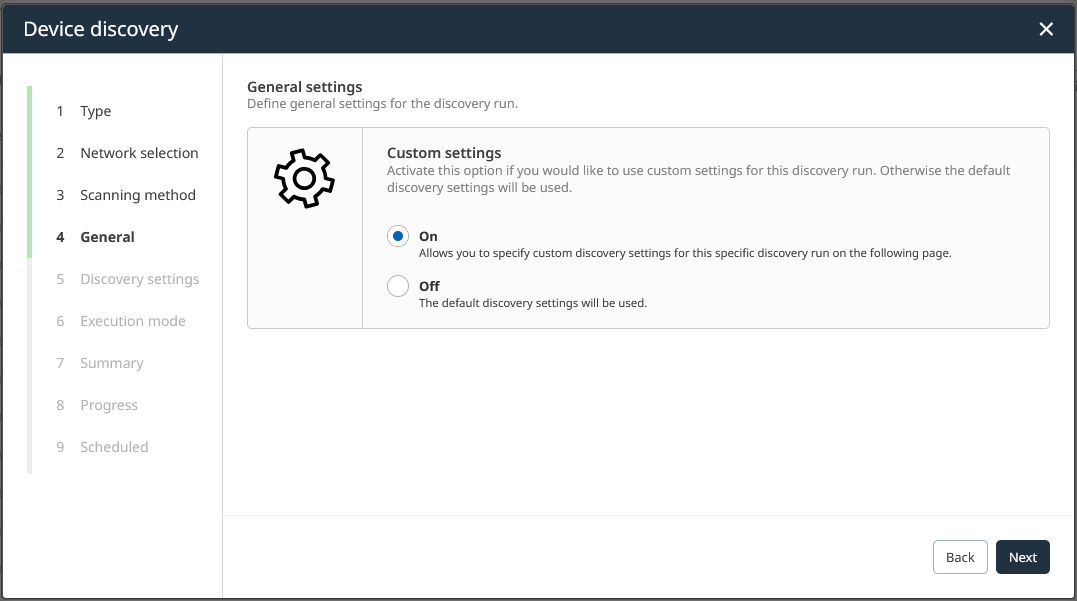
5.In this step, we have the option to include discovery-run local settings. In this example, enable the custom settings by selecting the On option. Click on Next to proceed.
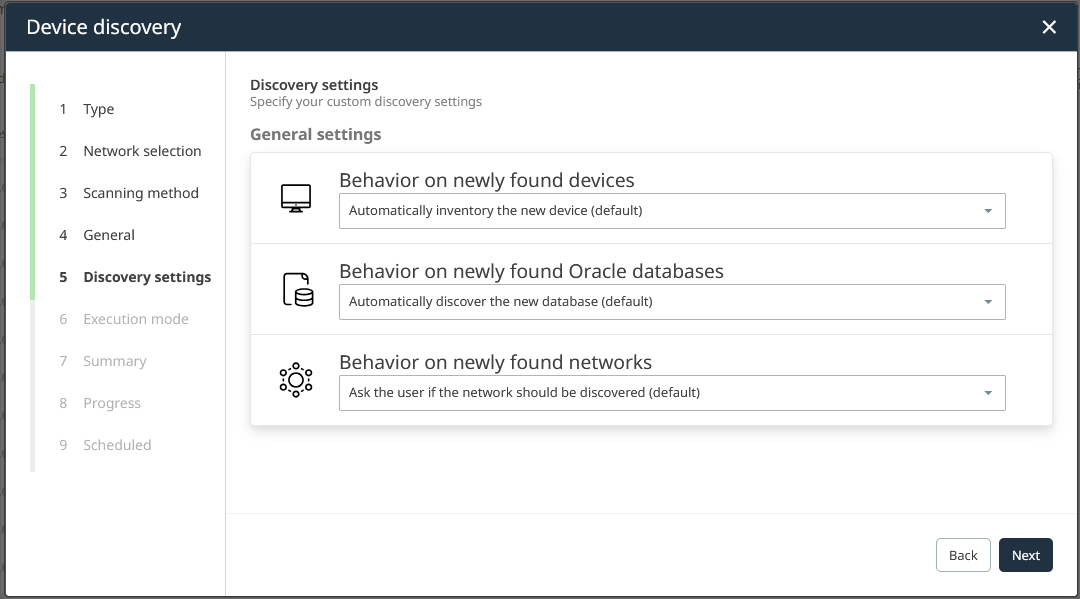
6.Define individual discovery settings for the current run. These settings apply to the configuring device discovery job only (discovery run scope). More information about them can be found in the Discovery settings chapter. We leave these settings as they are. Click on Next to proceed.
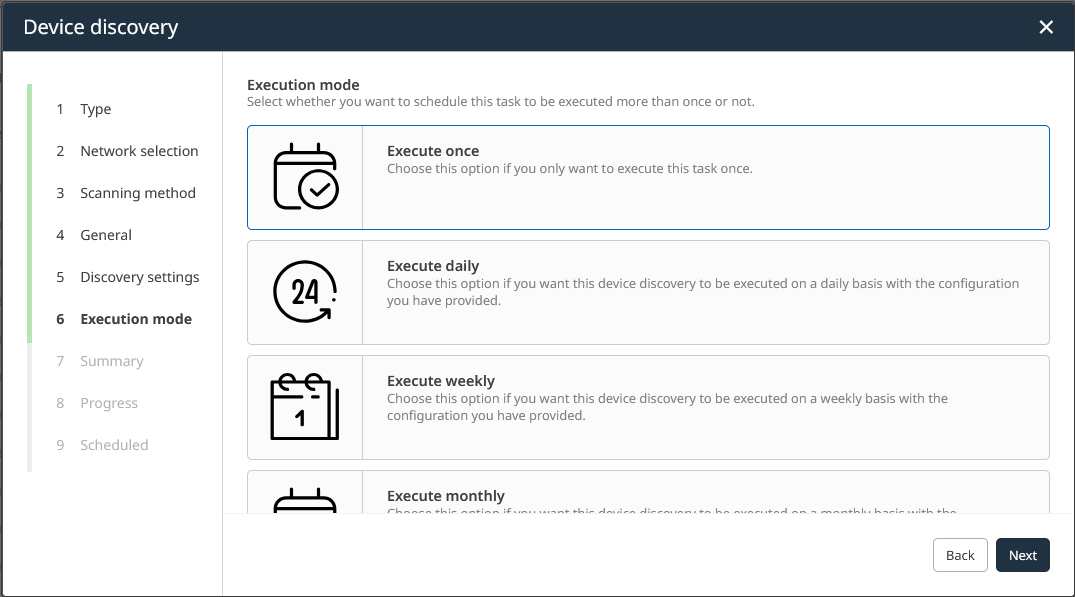
7.Define an execution mode for scheduling your discovery run. Select the Execute once option and click on Next to proceed. However, you can choose to trigger the job daily, weekly or monthly according to your requirements. Job automation is explained in a later chapter.
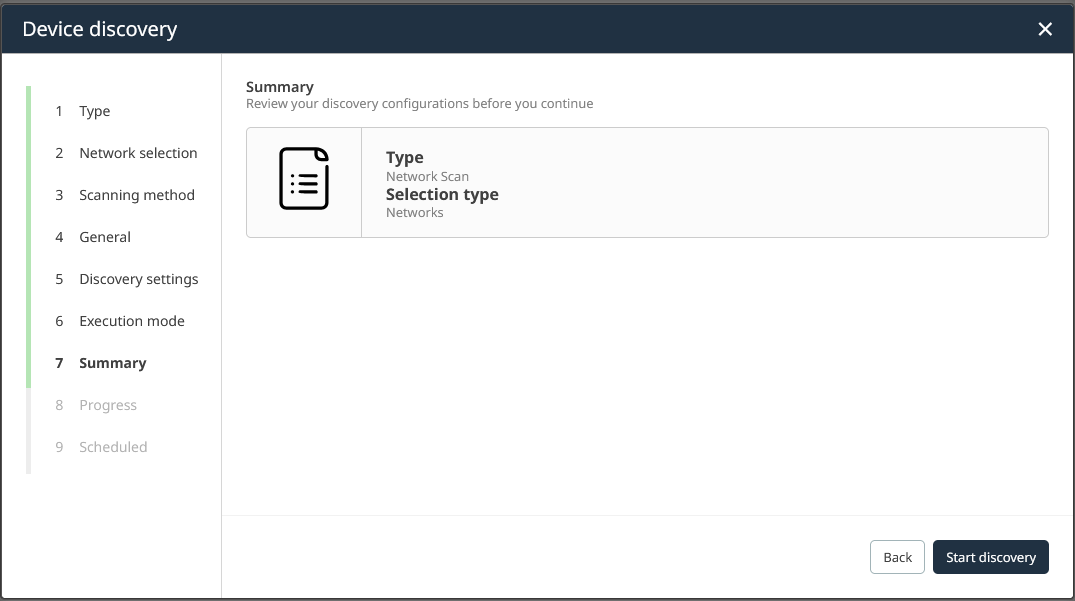
8.Once ready, click on Start discovery to request the job's execution. The Progress step will be shown briefly. Otherwise, you can always go back to previous steps for configuration revision.
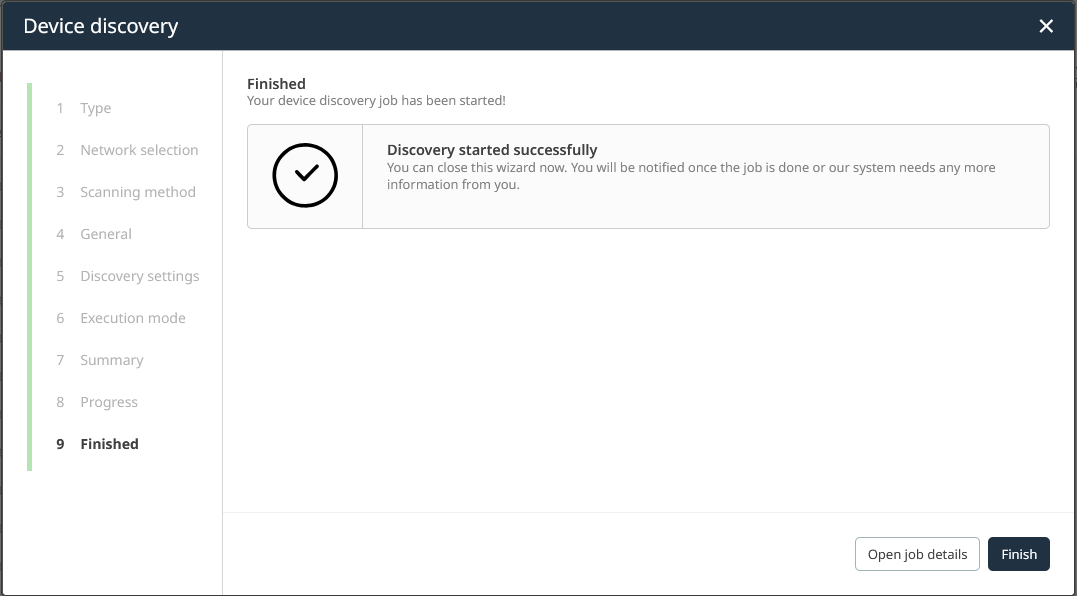
9.The Progress step is shown, informing you about the job scheduling execution. After the successful job request, the wizard switches to the Finished step. Click on Finish to finalize the process. Alternatively, you can open the Action Center to view details on your already triggered discovery run.
After successfully performing the steps above, you have learned how to trigger discovery of your IT landscape in basic terms. Getting the basics right truly matters to create user friendly solutions. For more elaborate management scenarios, you have the option to add even more networks or schedule multiple distributed jobs per automation.
Up to now, you have learned how to detect live resources only. But what about importing of devices from predetermined network resource databases/registries? Continue your discovery exploration journey by reading the next chapters.
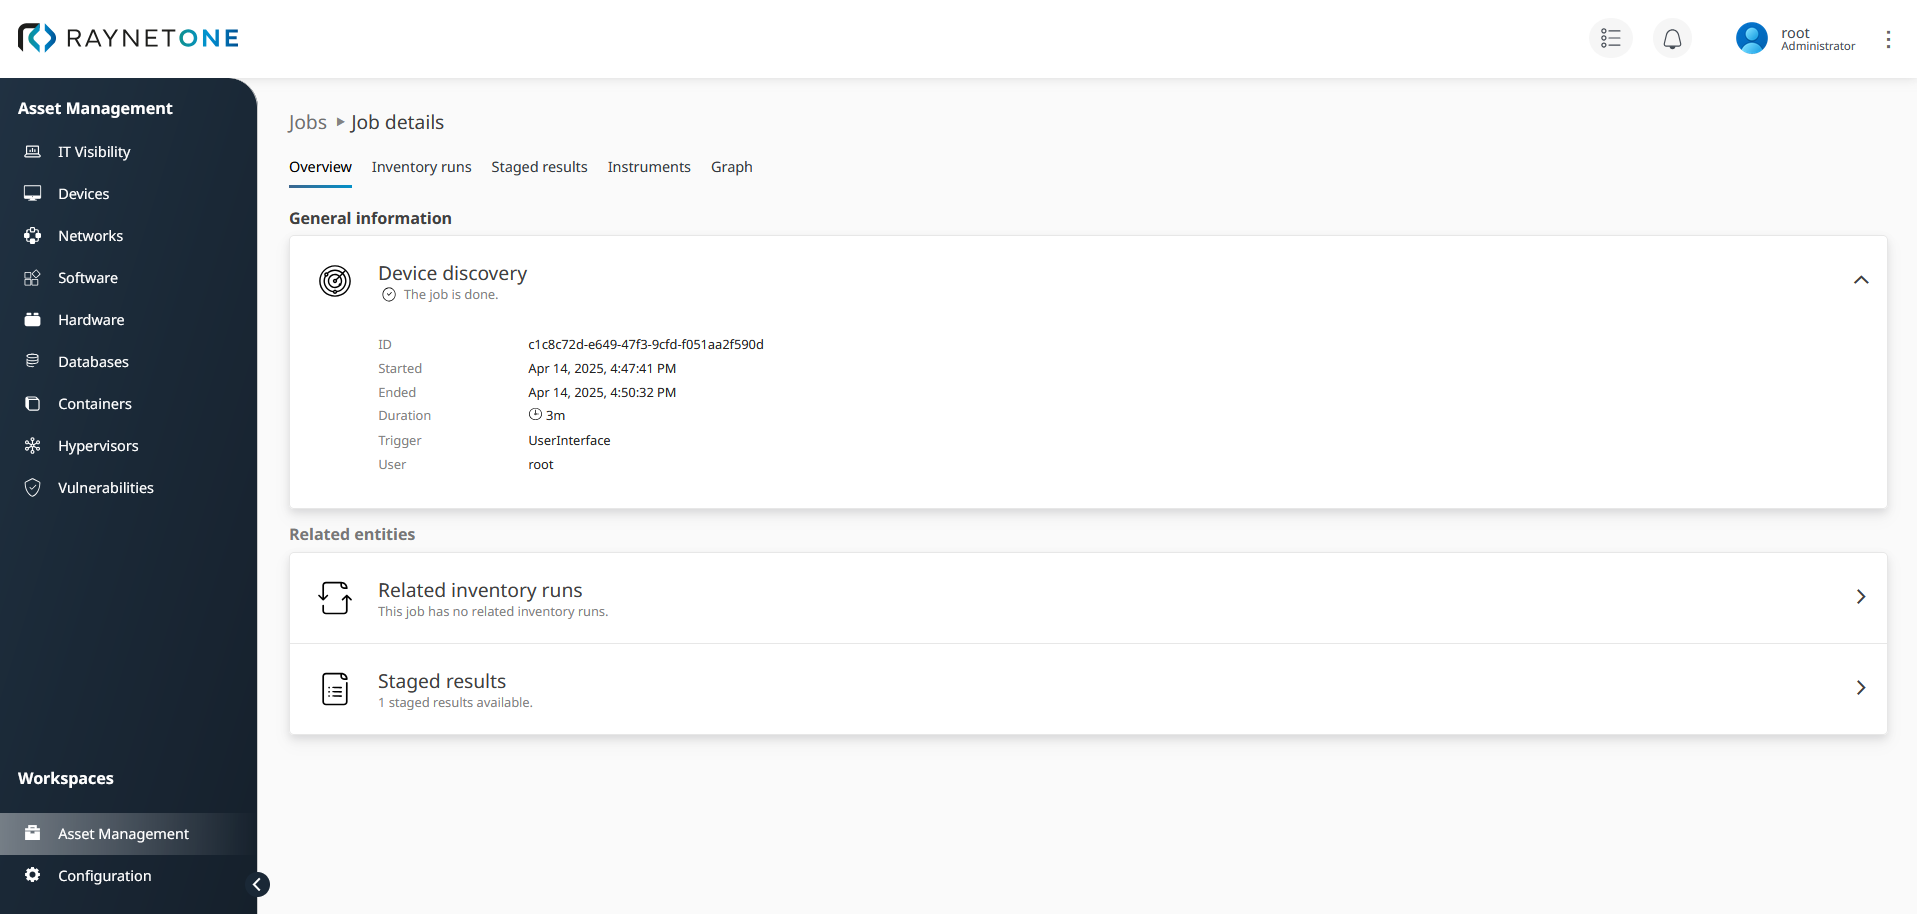
Check out the job's details view to track its progress. Realize the resource relationships inside of your network by detailing various discovery operations. The job's progress shows all the networks we have selected to discover. As part of network discovery, the system performs device discovery on all detected ones. The progress details also include the discovery methods, in our example the Ping Sweeper. Since we have selected to inventory any discovered device automatically, you will find inventory run details included in this job's progress aswell. In summary, the job details view is a comprehensive tracking solution for platform operations!