In the Devices view, you find all relevant information about existent devices in your environment - both on an overview and a device-specific detail level (also see chapter Details view). The Devices view includes three main tabs: All Devices, Automation and Troubleshooting.
All devices
The All devices tab leads you to a complete list of devices (workstations and servers) which are available in your environment. It is one of the central views, exposing a large set of key functionality.
In this view, you can perform the following actions:
•adding new devices,
•removing devices,
•importing devices from sources (MECM, AD),
•viewing device specifications in the Details view, e.g. installed software packages, device-specific hardware, services and assigned ports, and
•starting a device scan in the Details view, either Manually or via the Device Discovery option, in case you need to inspect a specific device.
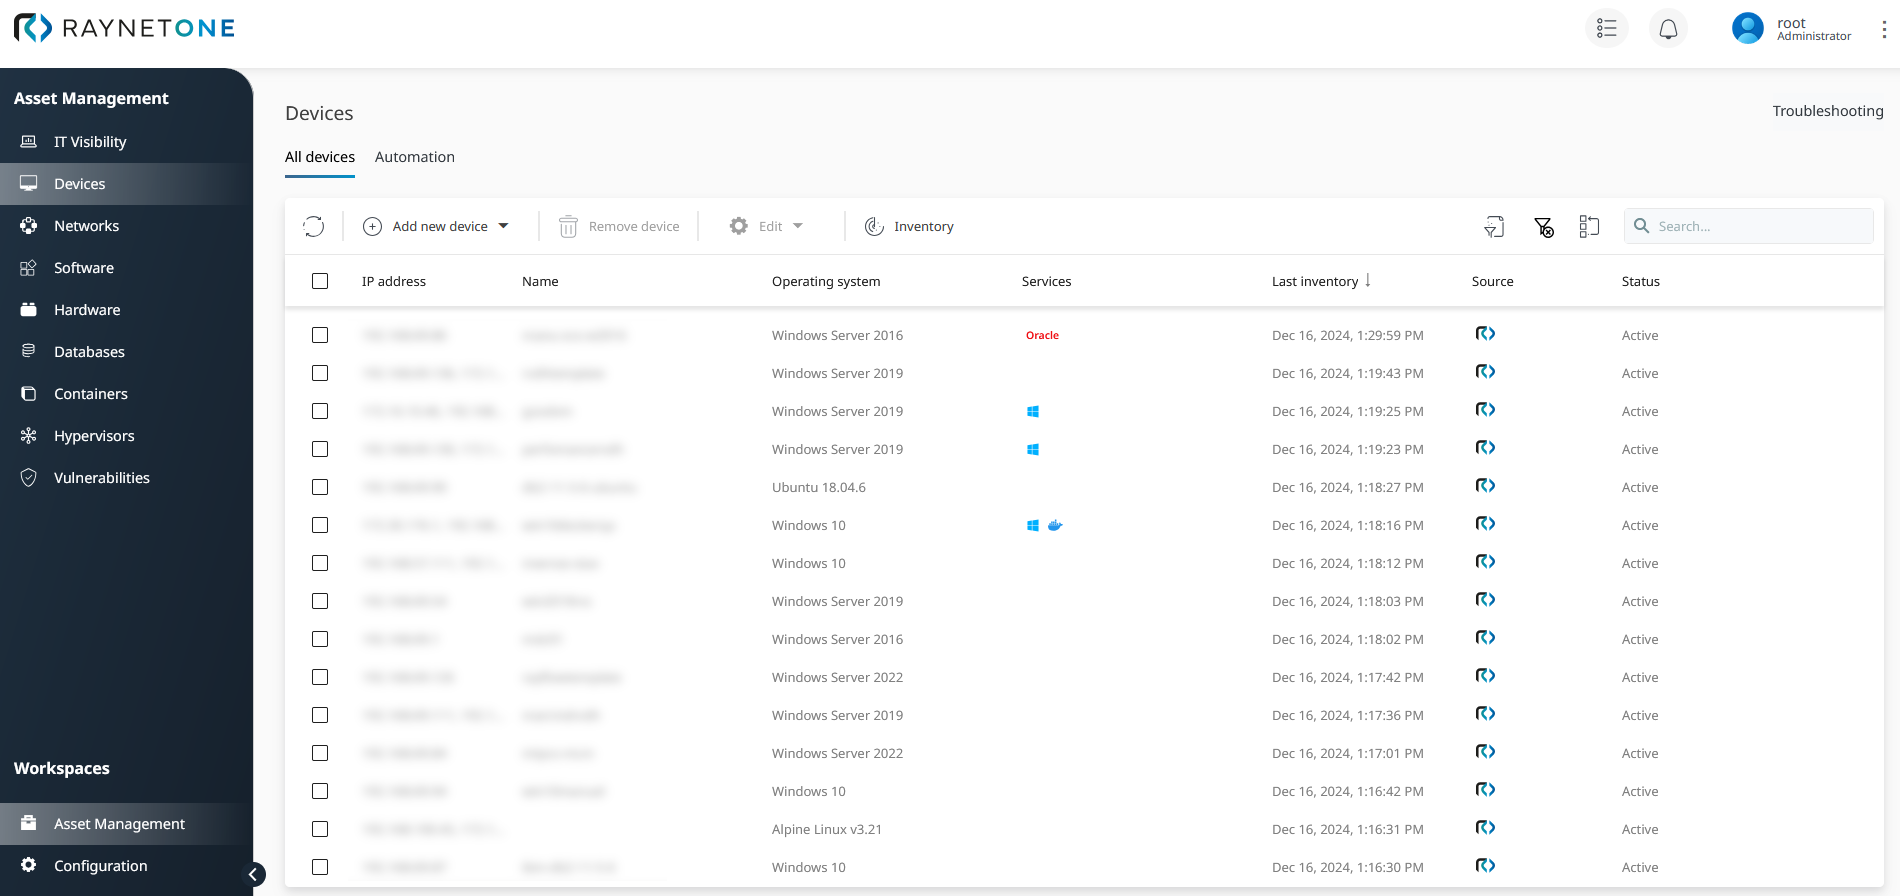
Complete overview of all devices within your managed environment.
In the Details view, you get deeper insights into the specifications of the selected device. From this point, you can access detailed information on installed software, hardware versions and features, related services of and ports used by the device. The following picture provides a brief excursion into the device details view.
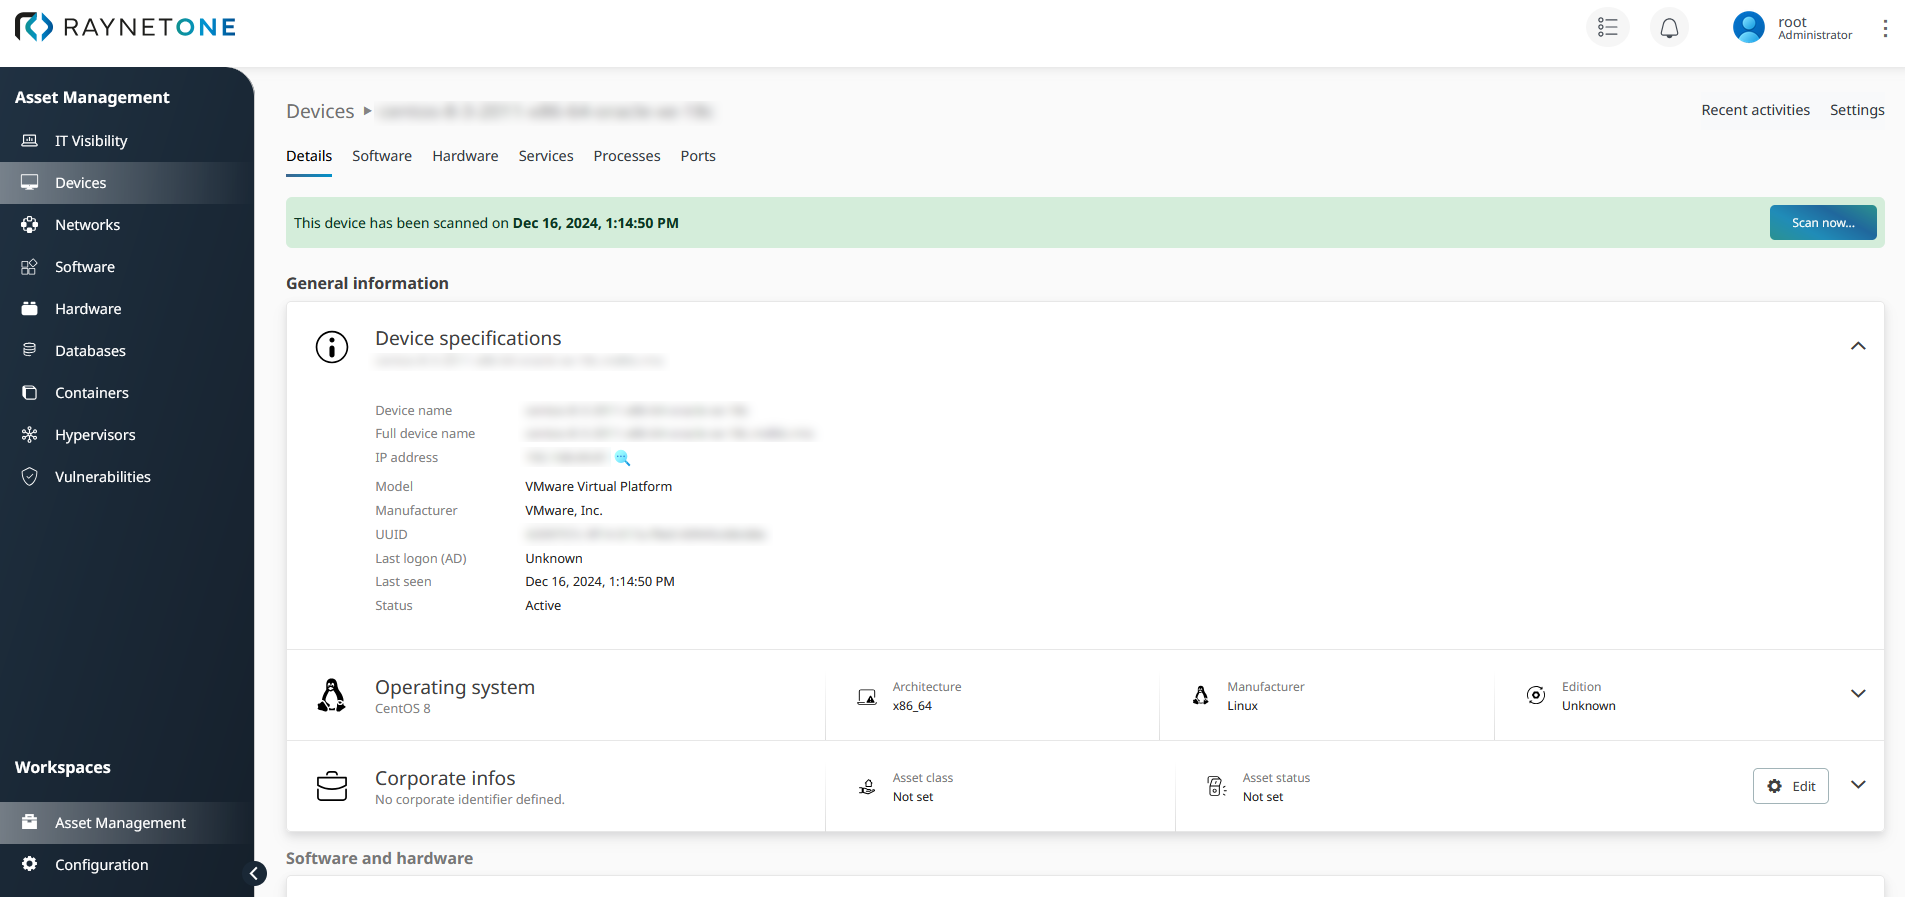
The details view of an individual device. It displays the operating system, IP addresses, software and meta-data of devices. Click on the options provided to view even more related detailed information.
Automation
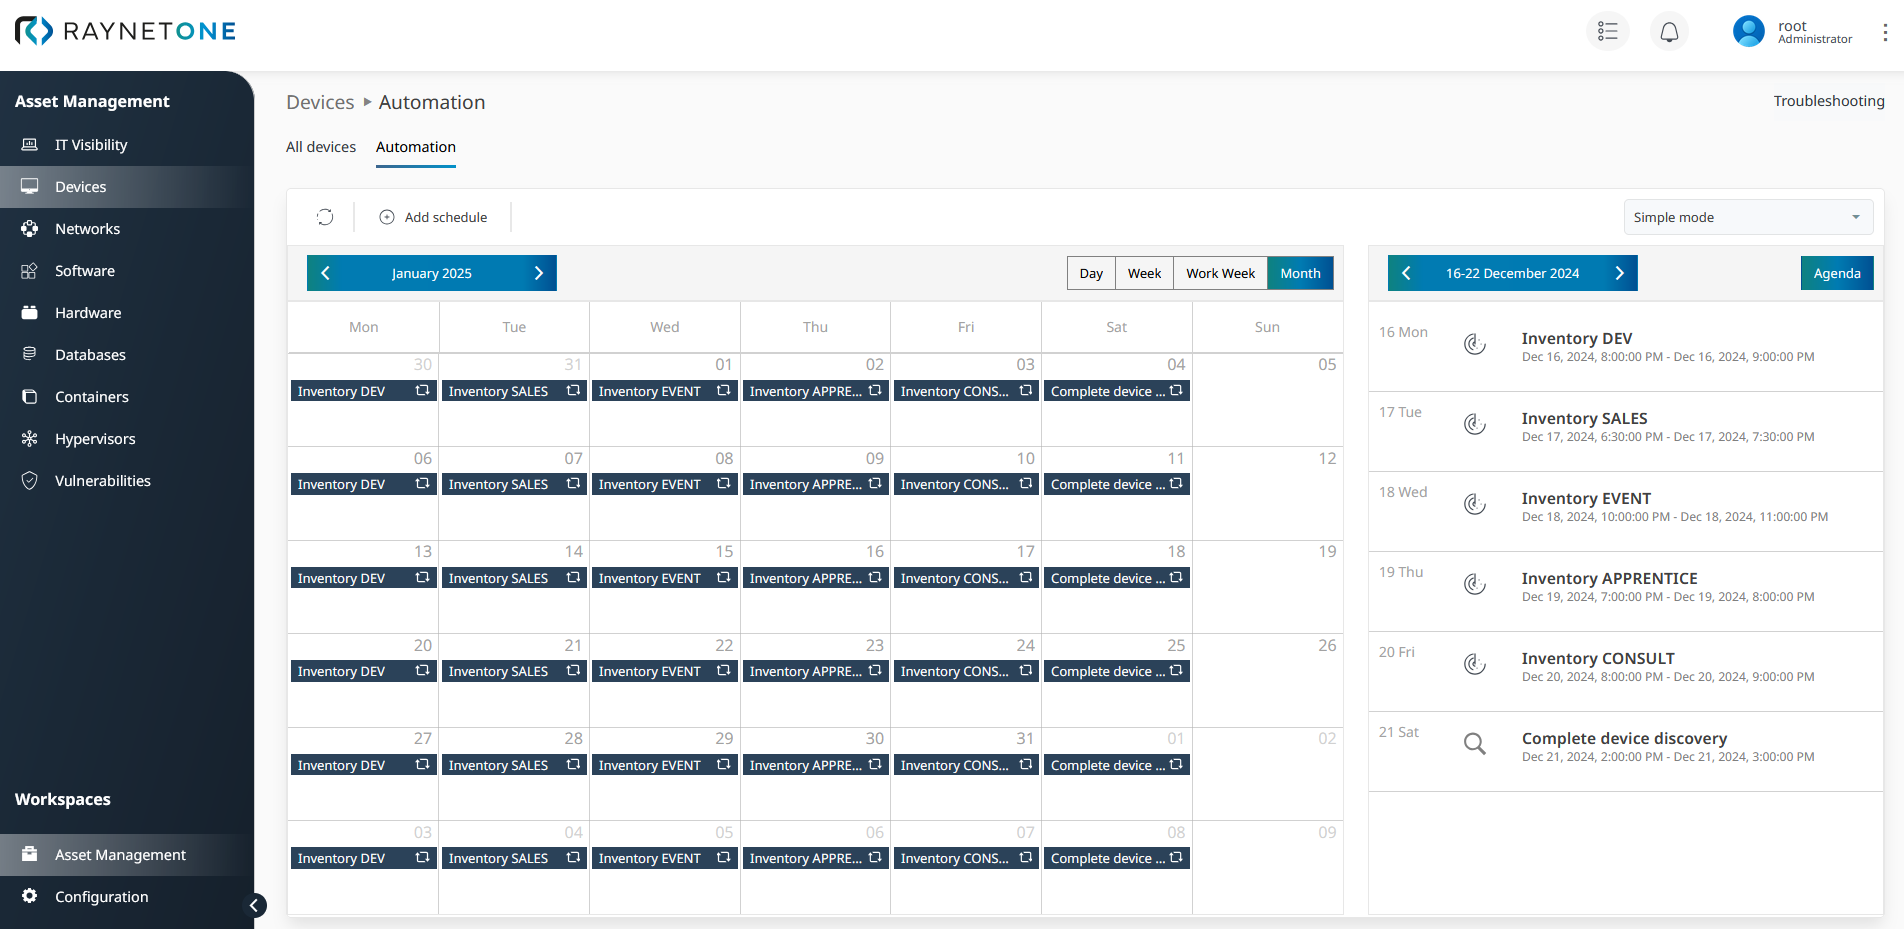
In this view, you can add, remove, adjust and view device schedules under the Automation tab, e.g. for inventory runs as a recurring operation. This view is available in two modes: Simple mode and Expert mode.
In the Simple mode, you can add schedules for automated discovery and inventory runs via an adjustable calendar view.
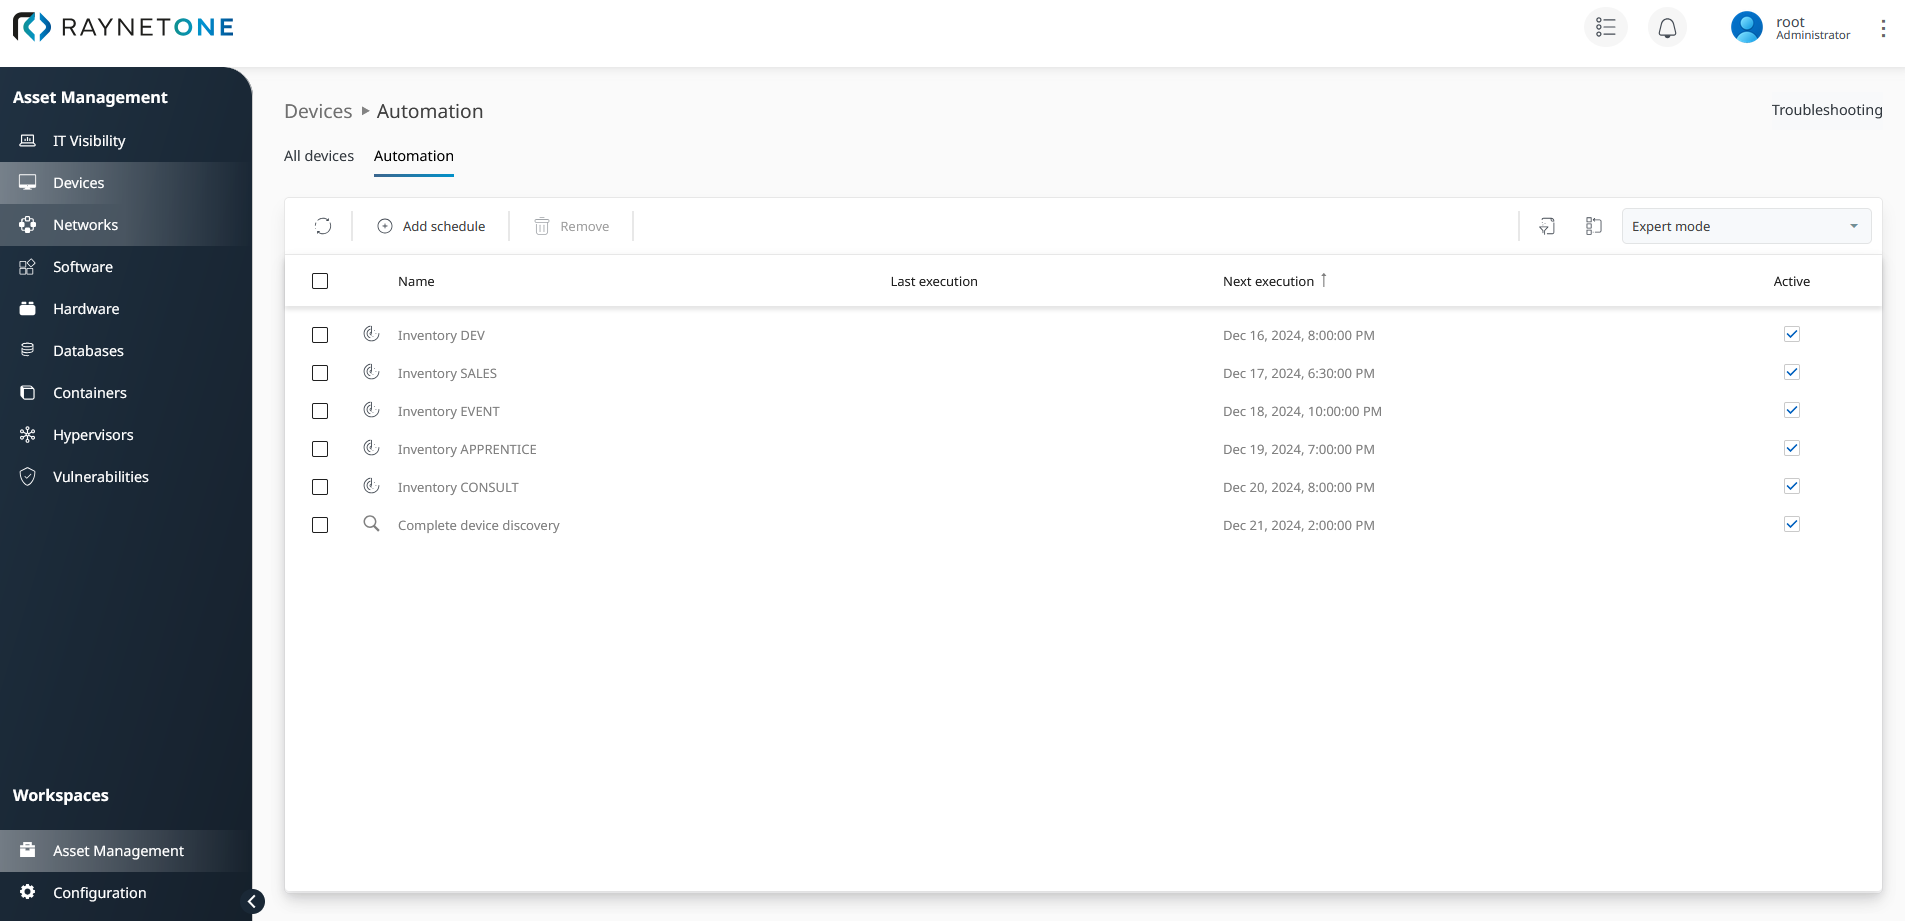
The Expert Mode view displays all scheduled discovery and inventory tasks as interactive and adjustable list entries.
To get a basic idea about the job automation motivation, check out the inventory load distribution use case.
Troubleshooting
The Troubleshooting view displays a list of devices on which inventory runs failed. There are many potential issues leading to failed operations, e.g. missing or invalid credentials on devices, and defective or otherwise inaccessible devices. However, troubleshooting enables you to detect and eliminate potential error sources. For deeper insights, you can open the respective device's details view.
In the Troubleshooting details view, you can perform the following actions:
•view failed inventory reports and skipped instruments,
•view device-specific inventory failure reports,
•start a new inventory run (also possible directly via the Inventory tab in the toolbar) and
•view inventory run details.
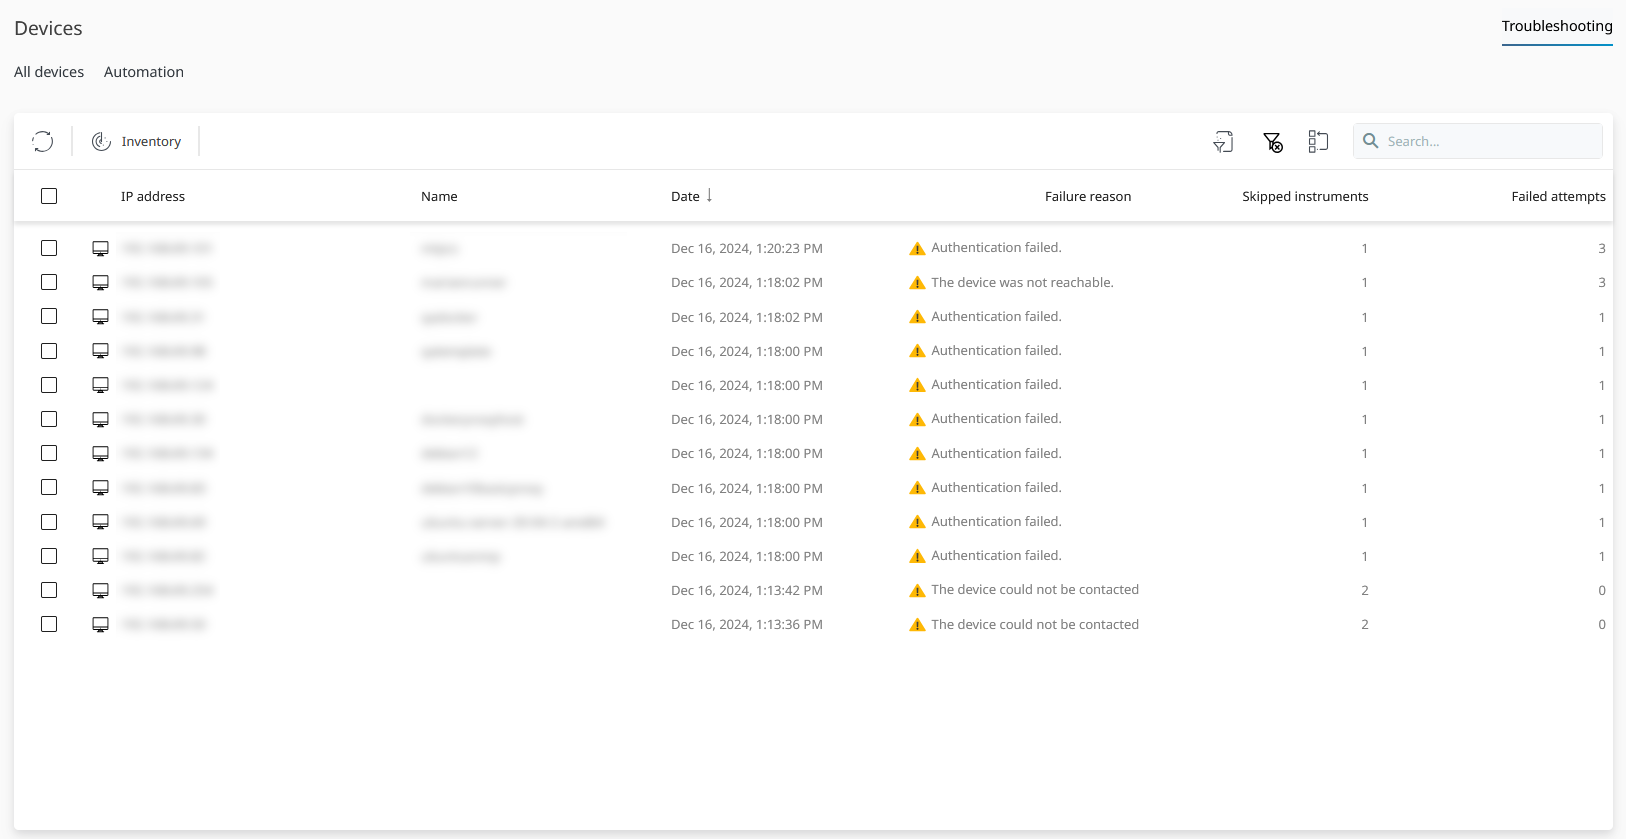
Complete list of devices on which an inventory run failed.
In the device details view under Troubleshooting, you can inspect individual devices which caused failure. This view includes two tabs: Details and Inventory run. Under the Details tab, you can detect device-specific error sources.
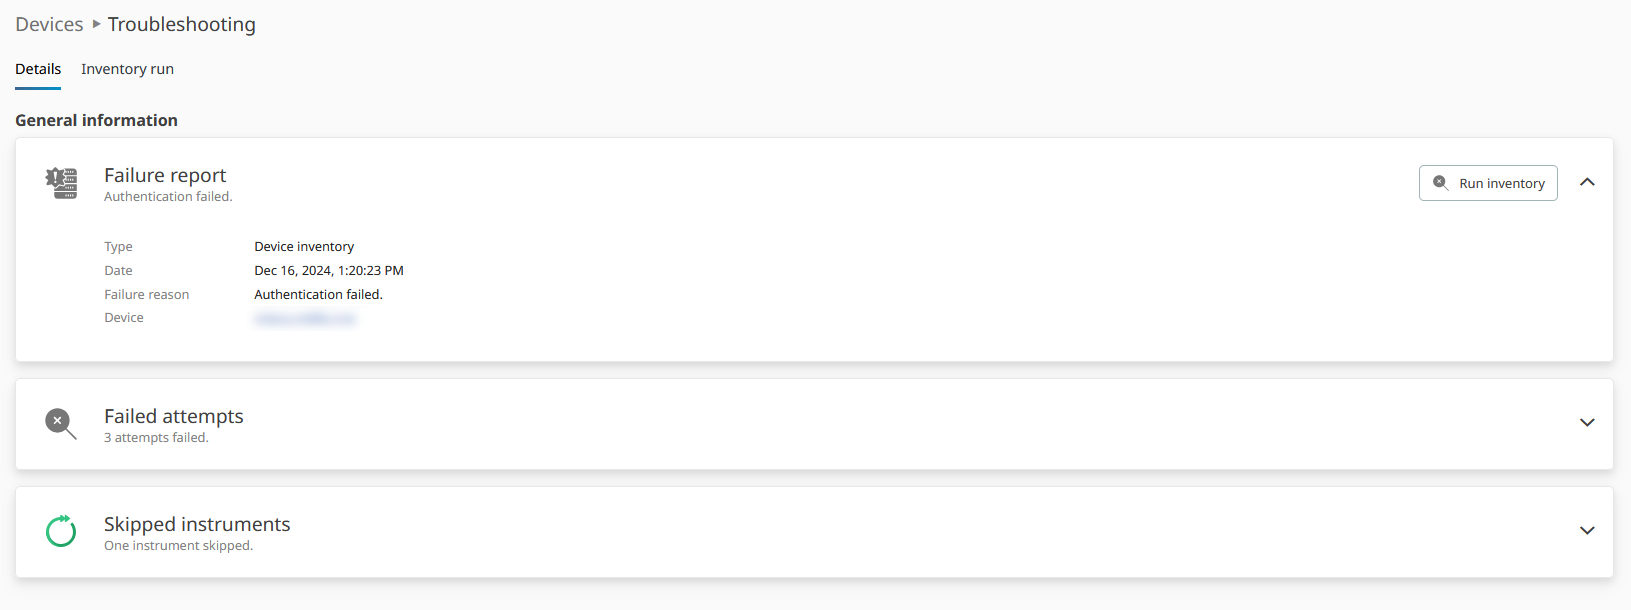
Details view of a selected list entry from the Troubleshooting overview.
The view under Inventory run presents details on specific inventory runs which failed on the device in question.
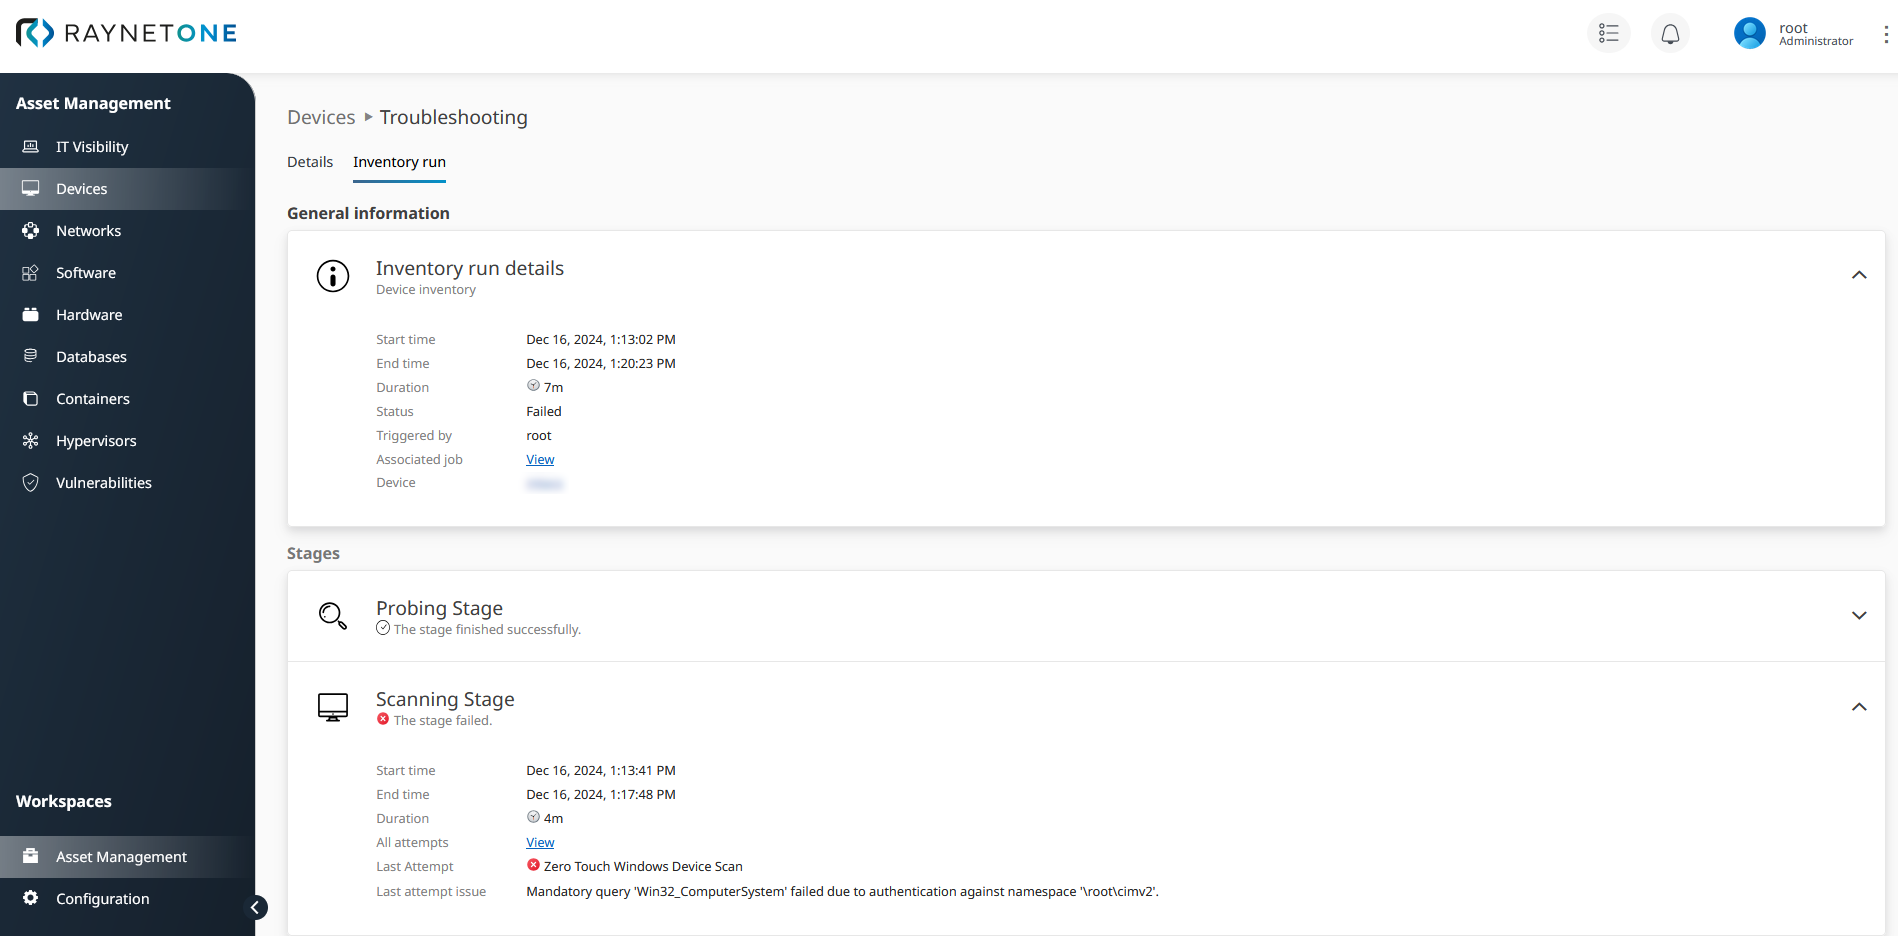
The Inventory run tab of the device troubleshooting page. Errors encountered during device inventory operation are displayed in great detail here. Click on any of the available links to jobs or instruments to learn more about the operational issues, using logs and even more specific issue classifications.