First and foremost, we require running jobs to work with. Let's start out by triggering the device inventory of our entire IT landscape. Assumingly, the distributed nature and IT landscape size will contribute to a rich job information view.
Requirements:
•at least a few discovered devices
•added authorized runner able to connect to the devices
•credentials capable for device authentication
1.Navigate to the list of all devices.
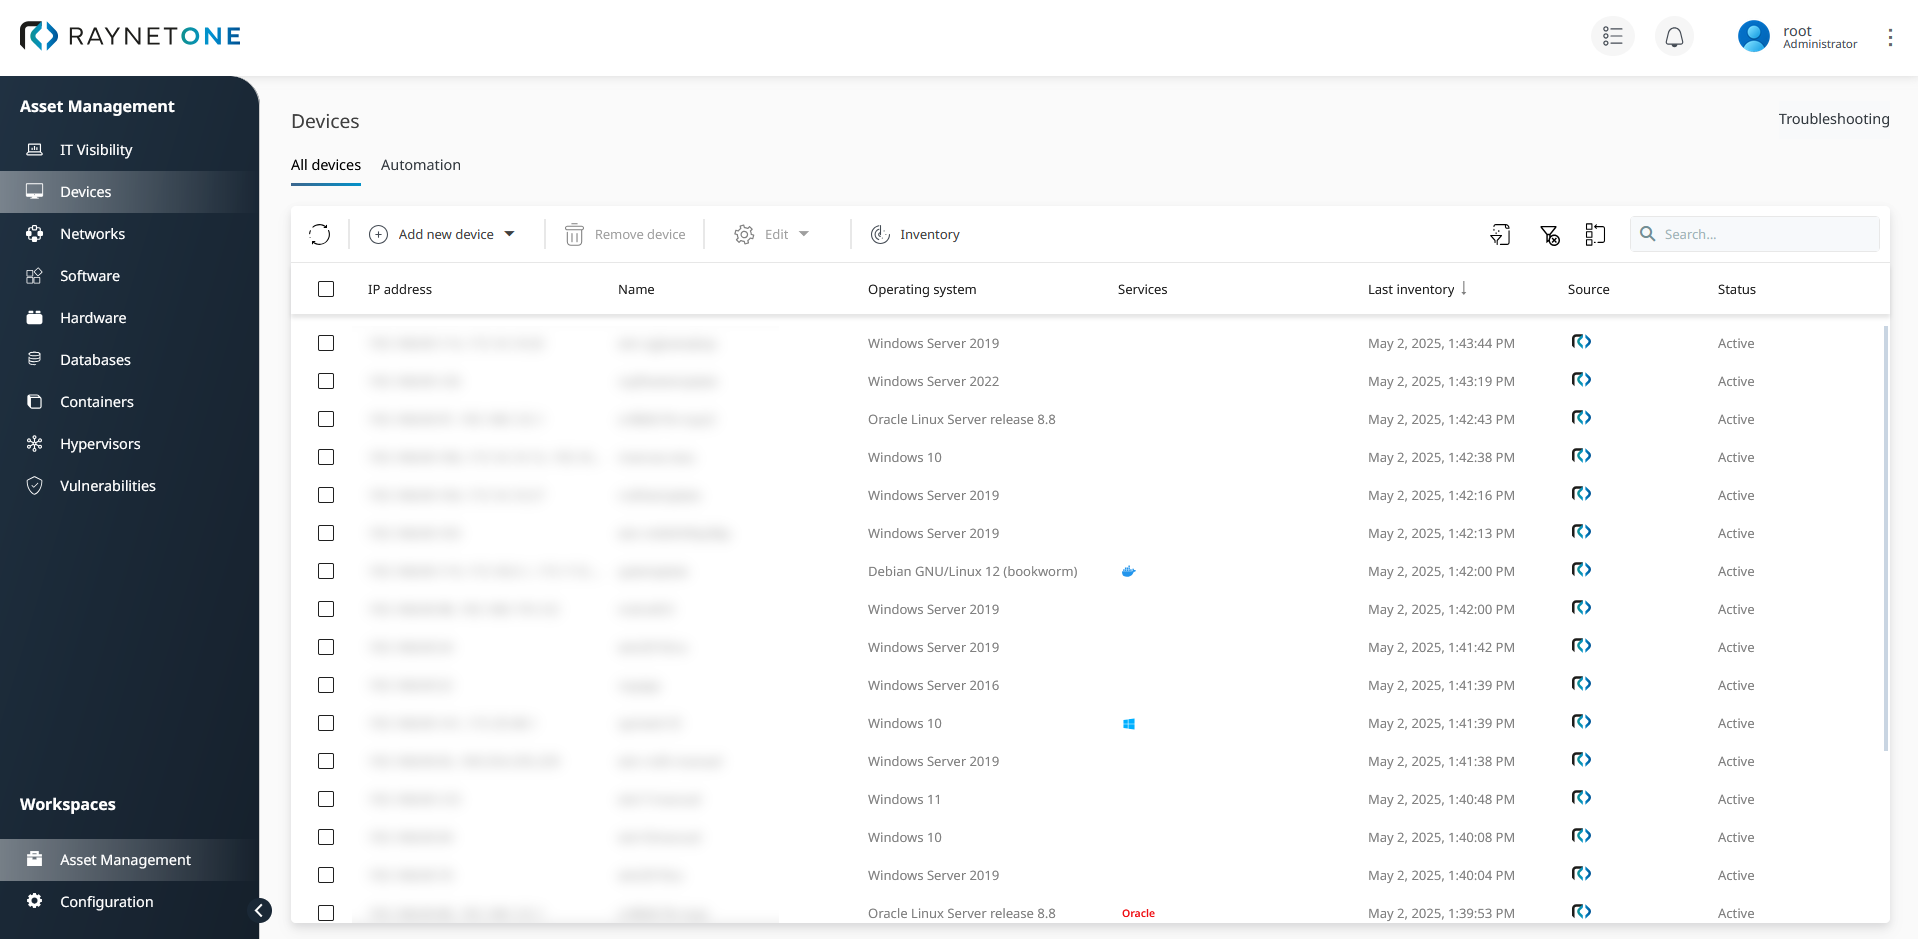
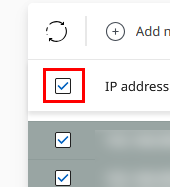
2.Select all devices by left-clicking on the check-box inside of the list-view columns row to the very left.
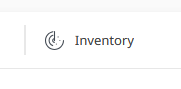
3.Trigger device inventory on the selected devices, using appropriate job configuration.
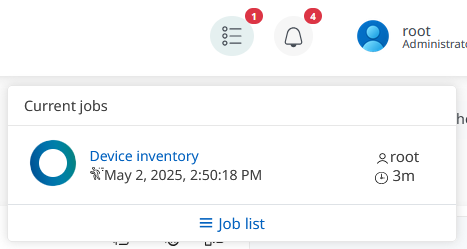
4.Check the job list button at the top right of the web page. It should contain a red circle with a white number one inside, indicating an active platform job. Click on the button to open the job list widget.

5.The job list widget lists one entry, the job we requested. Click on the job name inside to be forwarded to the job details view.
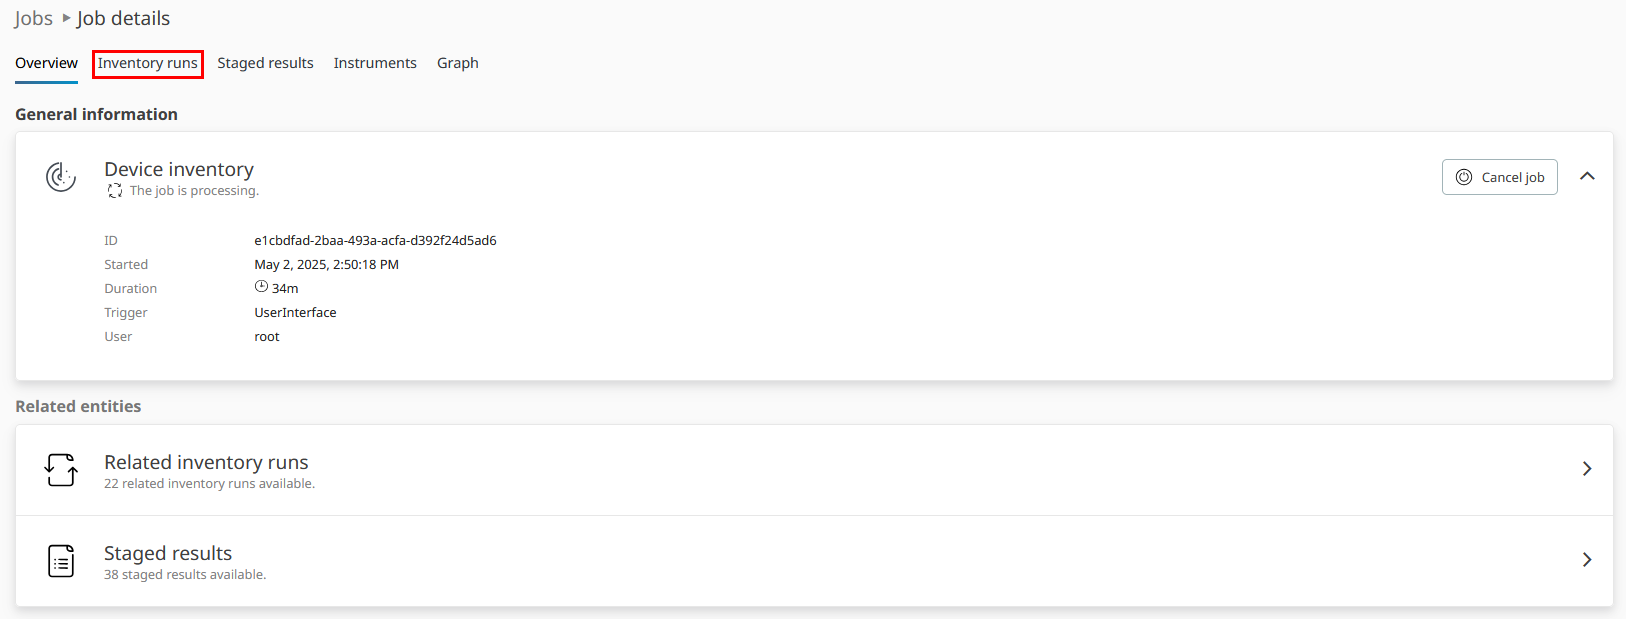
6.You have been redirected to the job details view. The Overview page shows main job properties (identification, timing, responsibility, execution state). Running jobs can be stopped via click on the Cancel job button. Click on the Inventory runs tab.
7.The Inventory runs tab lists all inventory attempts along their primary execution details. It's designed to present a compact overview of the current platform job execution state, in terms of resource inventory. Click on the State column once to sort it.
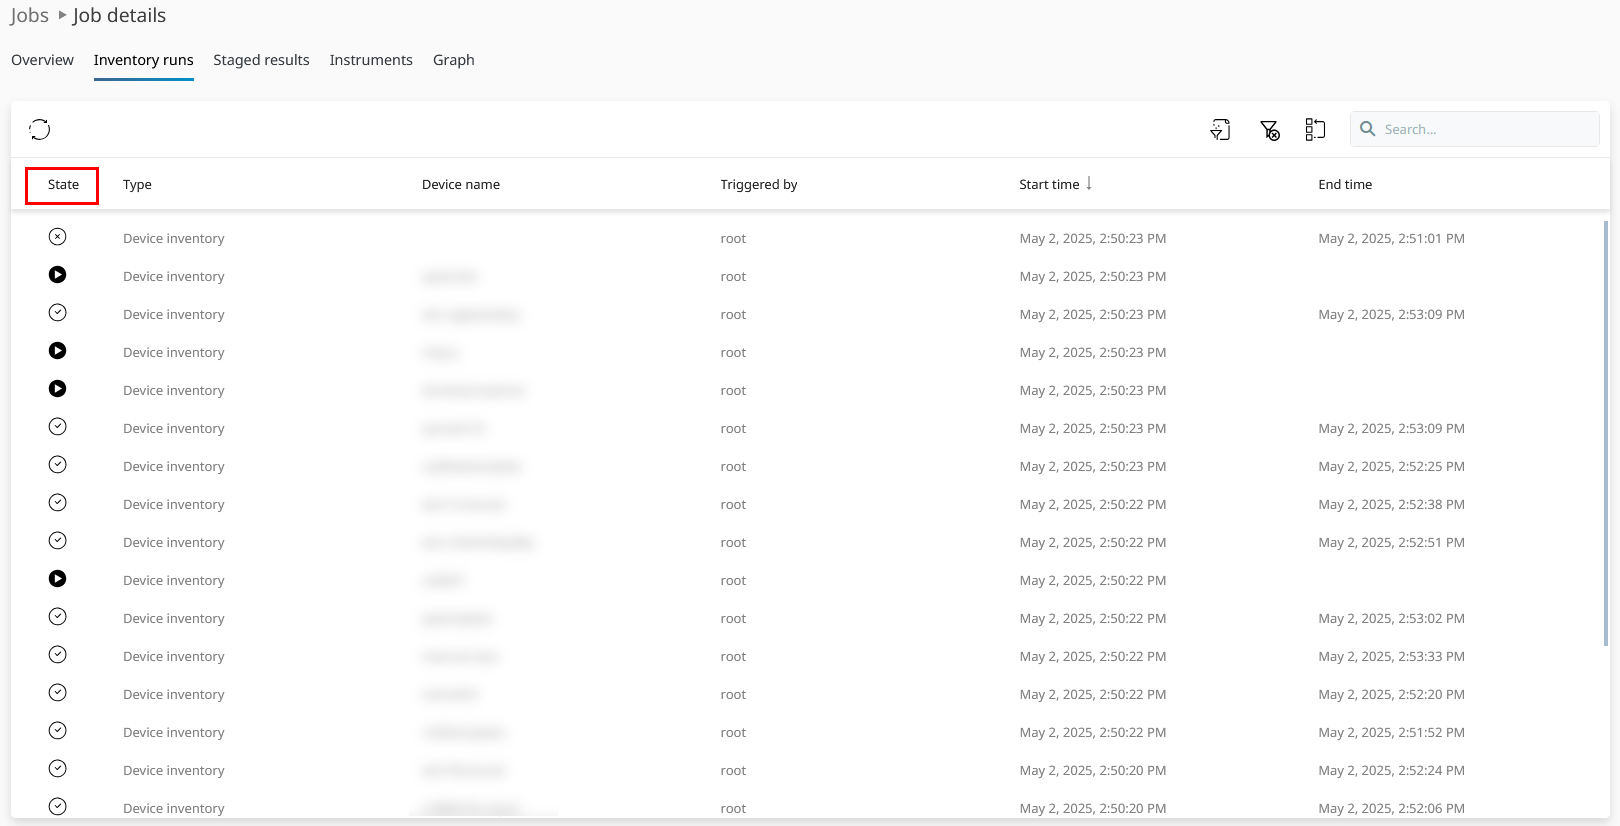
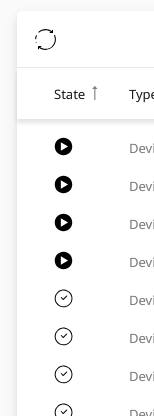
8.In a sorted list it is easy to estimate the proportions of successful, running and failed items. Use this information to assess the inventory collection efficiently. Device inventory should never fail, raising the need for troubleshooting. Moving on, click on the Staged results tab.
9.The Staged results tab lists all intermediate results of job execution. The displayed data contributes to the flow of job execution and inventory database building. You're going to find results of the Port Scanner or Zero Touch Inventory instruments pretty commonly. Proper continuation of platform jobs depends on successful importing of one stage's result as input data for another. The purpose of this tab is to give you confirmatory technical information about proper internal platform operation. Next, click on the Instruments tab.
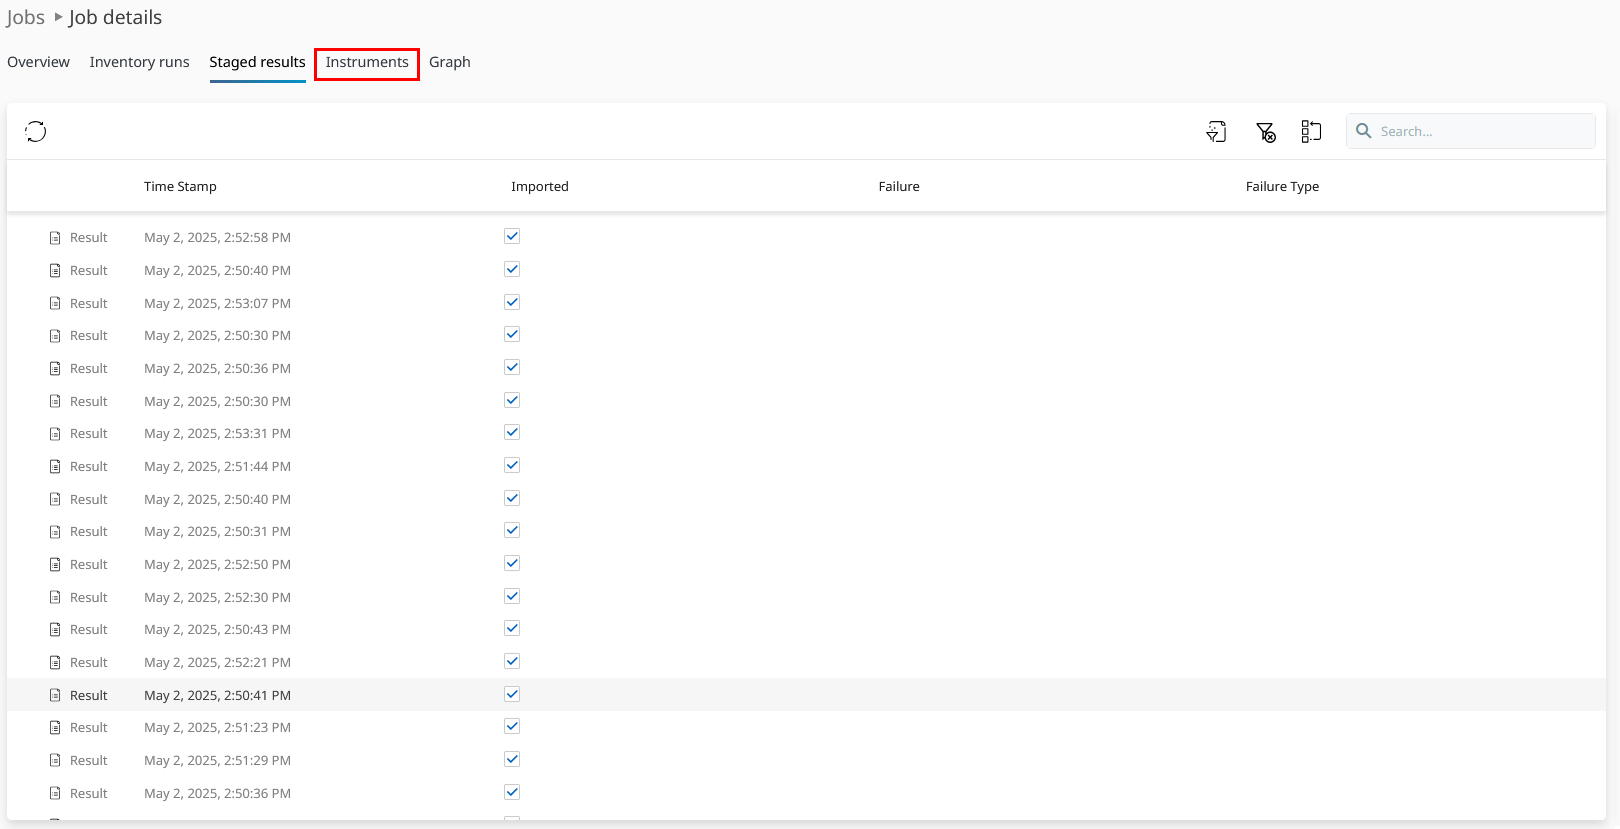
10.The Instruments tab lists all runner plugin executions and run-time related details. It is useful to get a complete overview of the computational workloads distributed among your IT landscape. Instruments are responsible for actual interfacing with IT landscape resources and collecting the information leading to proper IT Visibility. The difference to Staged results is that one instrument could, theoretically, produce multiple results. Next, click on the Graph tab.
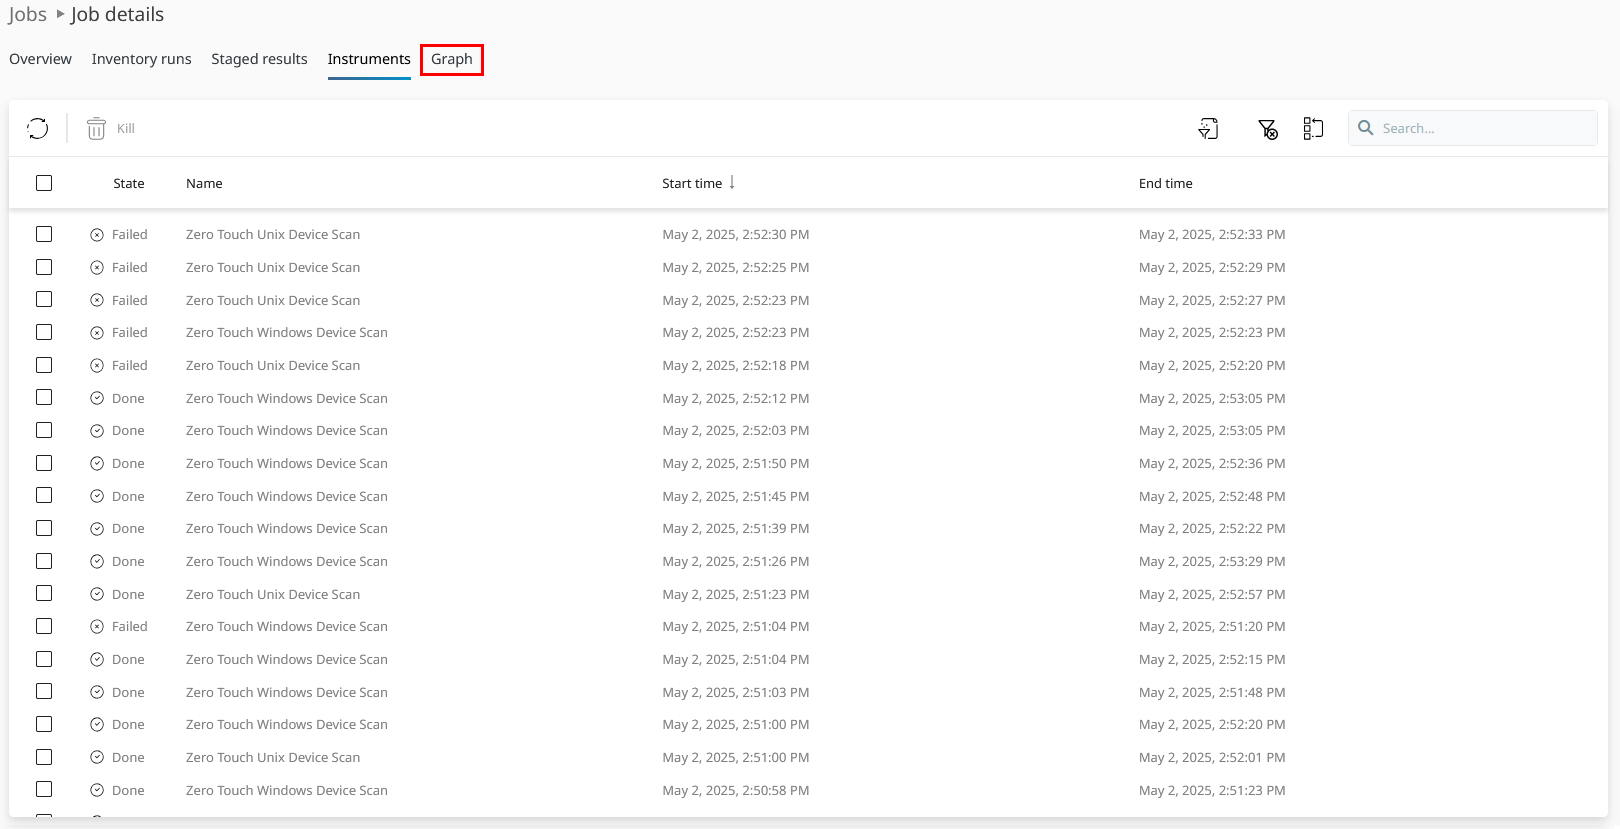
11.The Graph tab displays the job's execution flows. Each node in the graph represents a step in overall job execution. You can easily trace connections between steps by edges. Move around the view to visually recognize the job's structure. There is an entire chapter dedicated to working with the job graph.
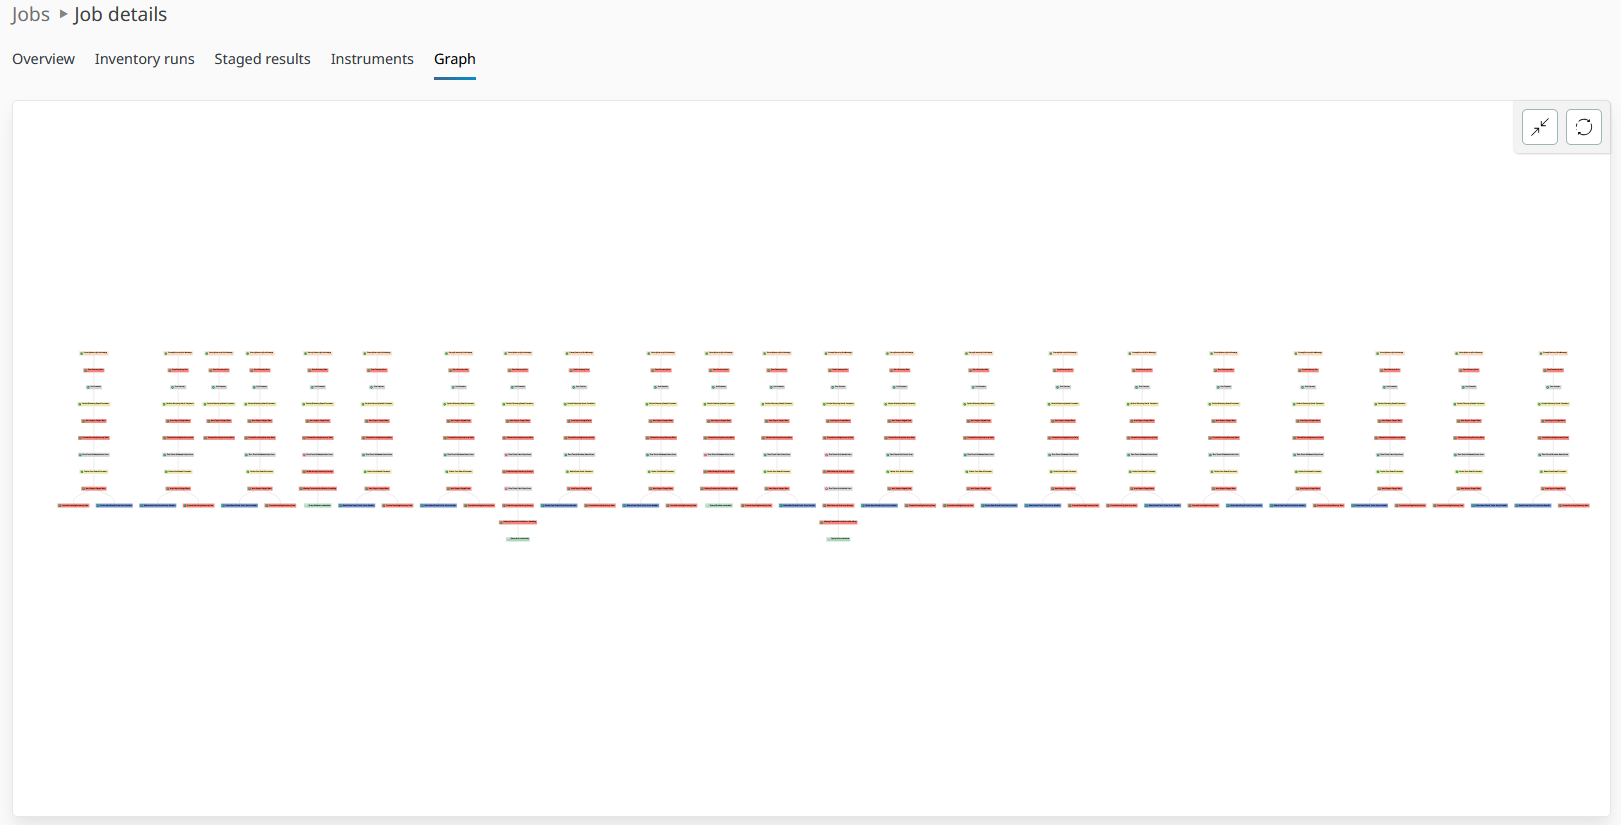
By performing the steps above we have glimpsed over the process of job analysis. Job information can be vast, technically deep and confusing. Realize the importance of a proper job analysis strategy.