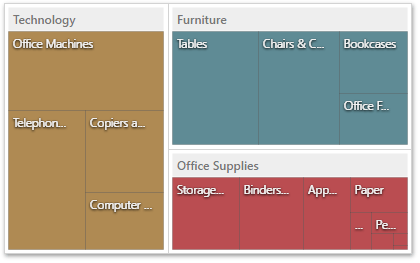
The Treemap dashboard item allows you to visualize data in nested rectangles that are called tiles.

This section consists of the following topics.
•Providing Data
Provides information on how to supply the Treemap dashboard item with data.
•Interactivity
Describes features that enable interaction between the Treemap and other dashboard items.
•Layout
Describes layout options of the Card dashboard item.
•Grouping
Describes how to group Treemap tiles intro groups.
•Coloring
Provides information about coloring.
•Labels
Provides information about labels and tooltips that contain descriptions of tiles.