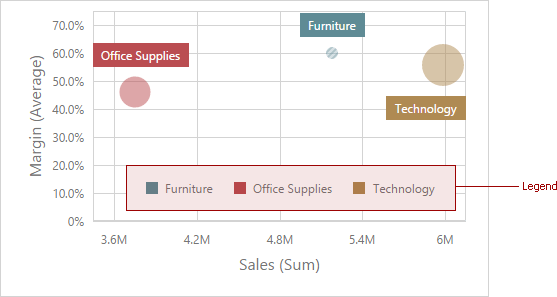
A legend is an element of a scatter chart that identifies chart points (for instance, colored points corresponding to argument values).

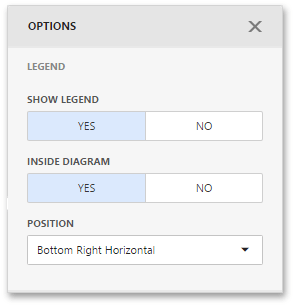
To customize legend options, go to the Scatter Chart's Options menu and open the Legend section.

The following settings are available.
Setting |
Description |
Show Legend |
Specifies whether or not to show a legend. |
Inside Diagram |
Locates a legend inside or outside the Scatter Chart. |
Position |
Sets a legend position and orientation. |