In the Transformation Graph tab, the selected transformation is shown as a graph. This offers a graphical overview over the different transformation steps and the order they will be executed. Furthermore it shows which steps in the transformation are mutually exclusive.
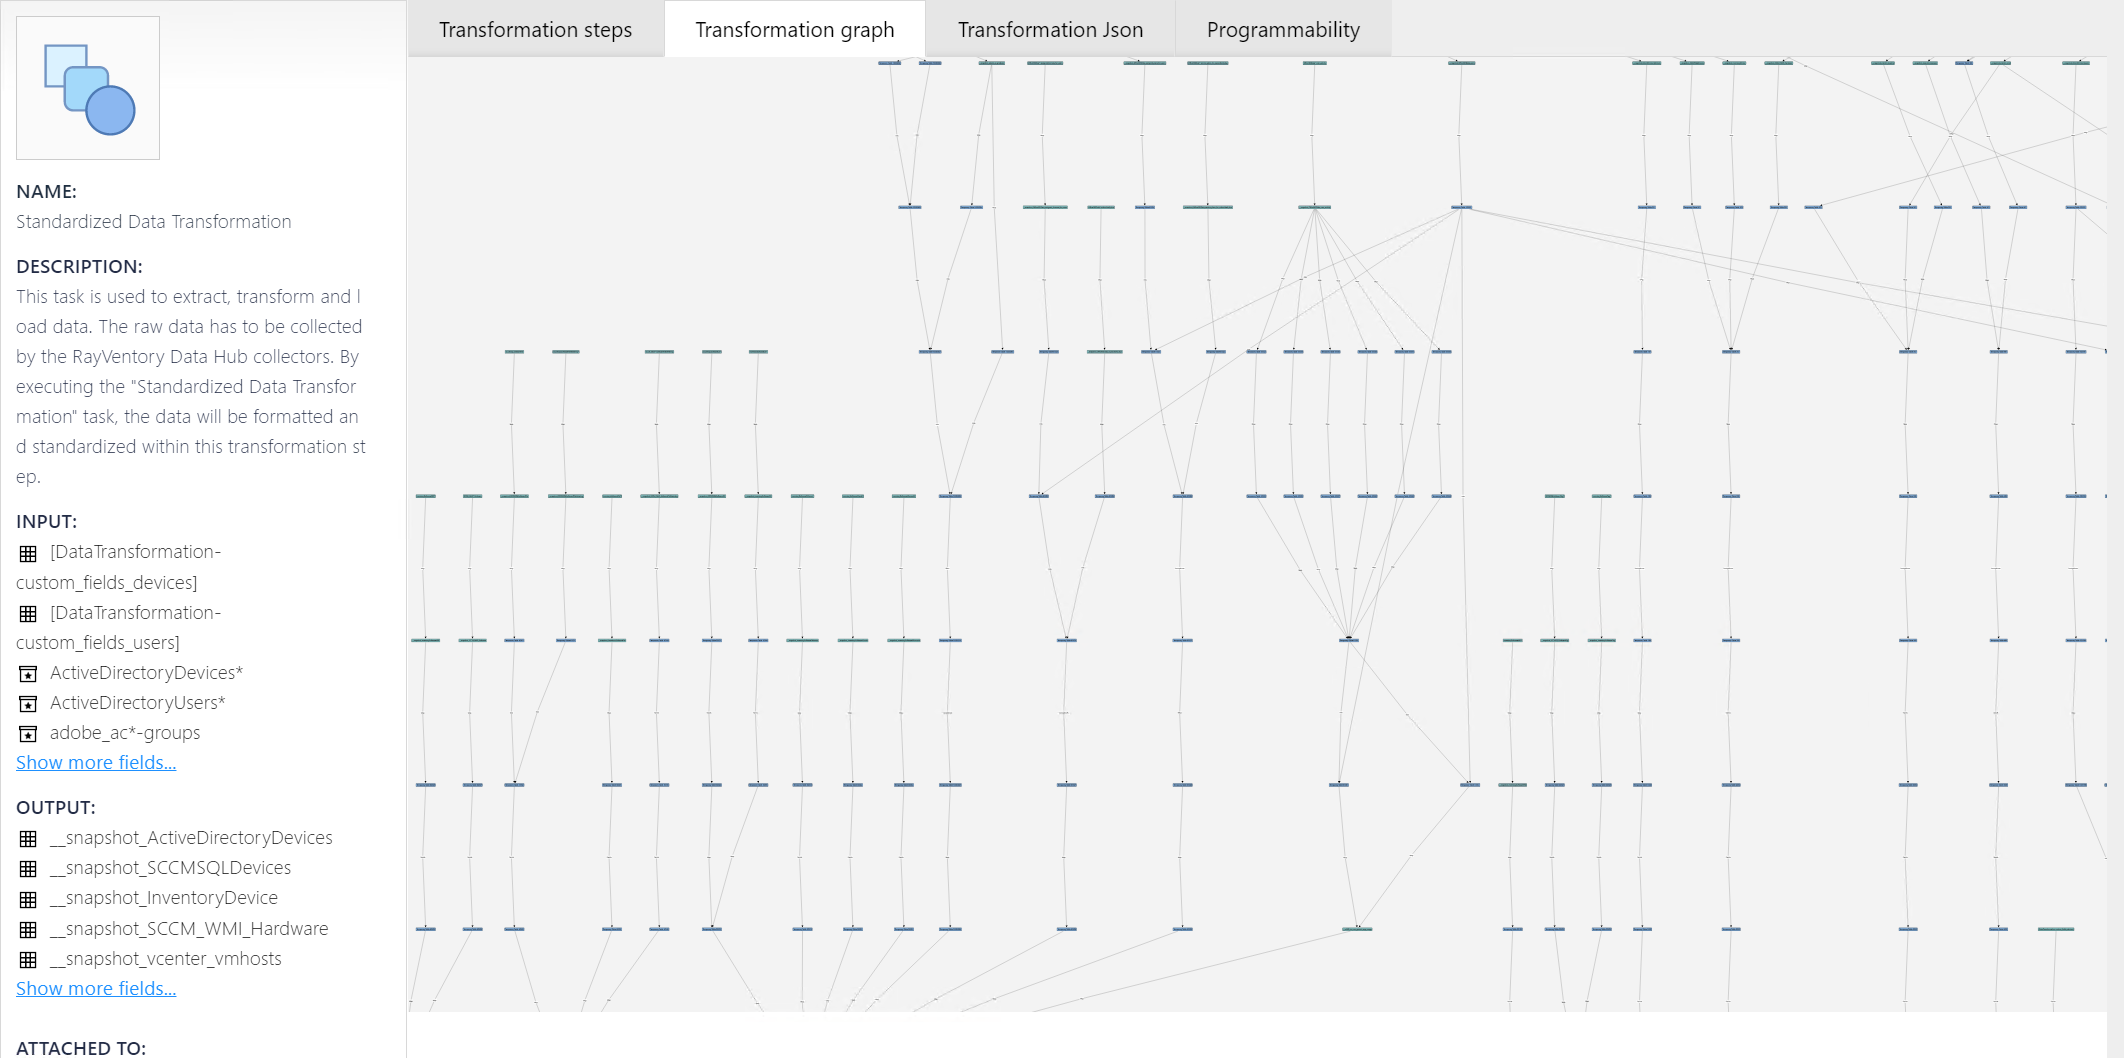
On the left part of the screen general information about the selected transformation can be found. This information include the name of the transformation, a description, as well as the input tables, the output tables, and the tasks which are attached to the transformation.
The transformation graph shown in the right part of the window is calculated once the tab is being opened. It shows a graph of all the steps that are part of the transformation.
To make it even more comprehensive, it is possible to drag the single nodes to another position. This will not change the position of the node in the tree itself, but only the arrangement in the UI where it is shown.
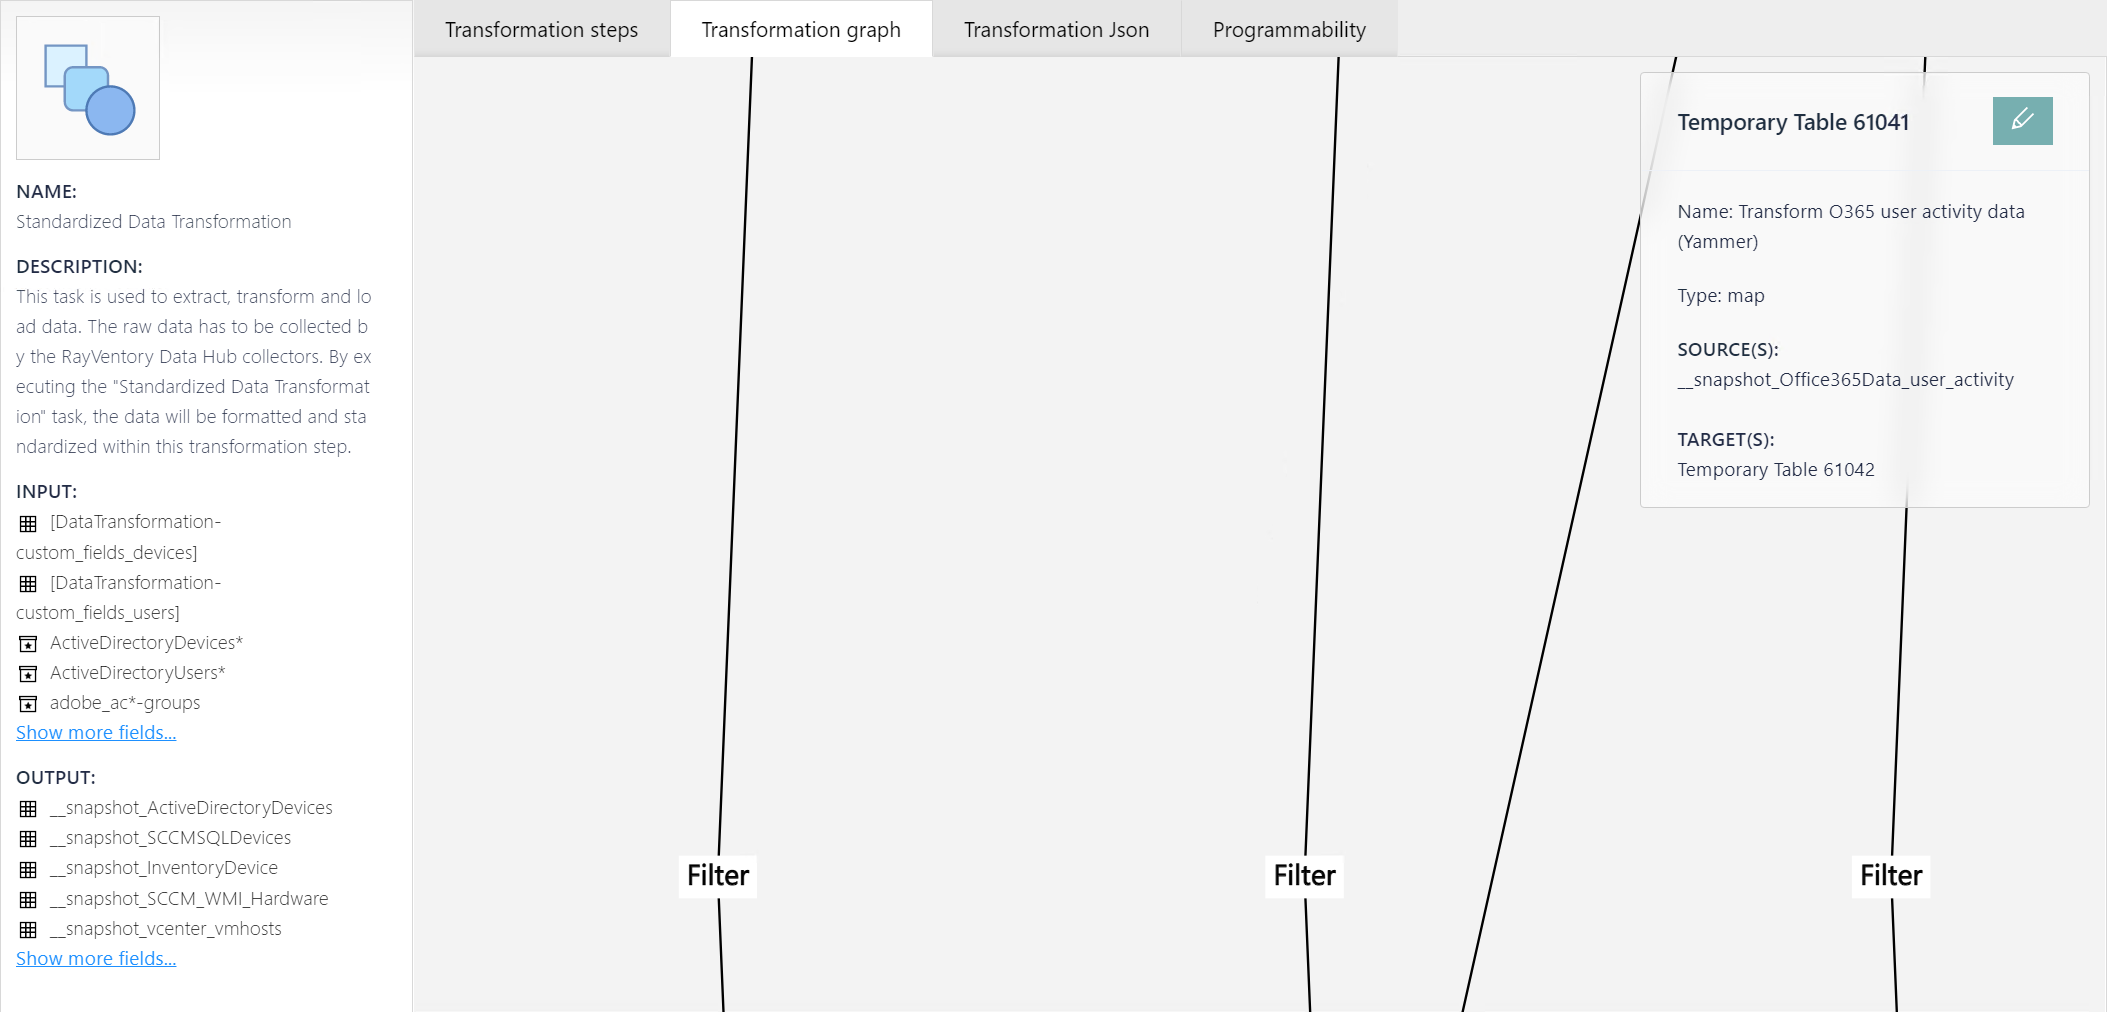
Furthermore, it is possible to click on a node to get more information about that specific node. The information about the selected node will be shown in a small dialog at the top right of the Transformation Graph tab.
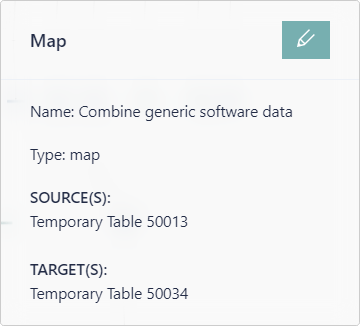
The following information are shown in the dialog:
•Name: This field contains the name of the transformation step.
•Type: This field contains the type of the transformation step. The type is also shown as header.
•SOURCE(S): This field contains the source table(s) which are used by the transformation step.
•TARGET(S): This field contains the output table(s) which contain the result of the transformation step.
Furthermore, there is an Edit button on the top right which can be used to open the Edit dialog.