The Raw Data section contains the unrefined data that has been collected by Raynet One Data Hub and saved to the database.
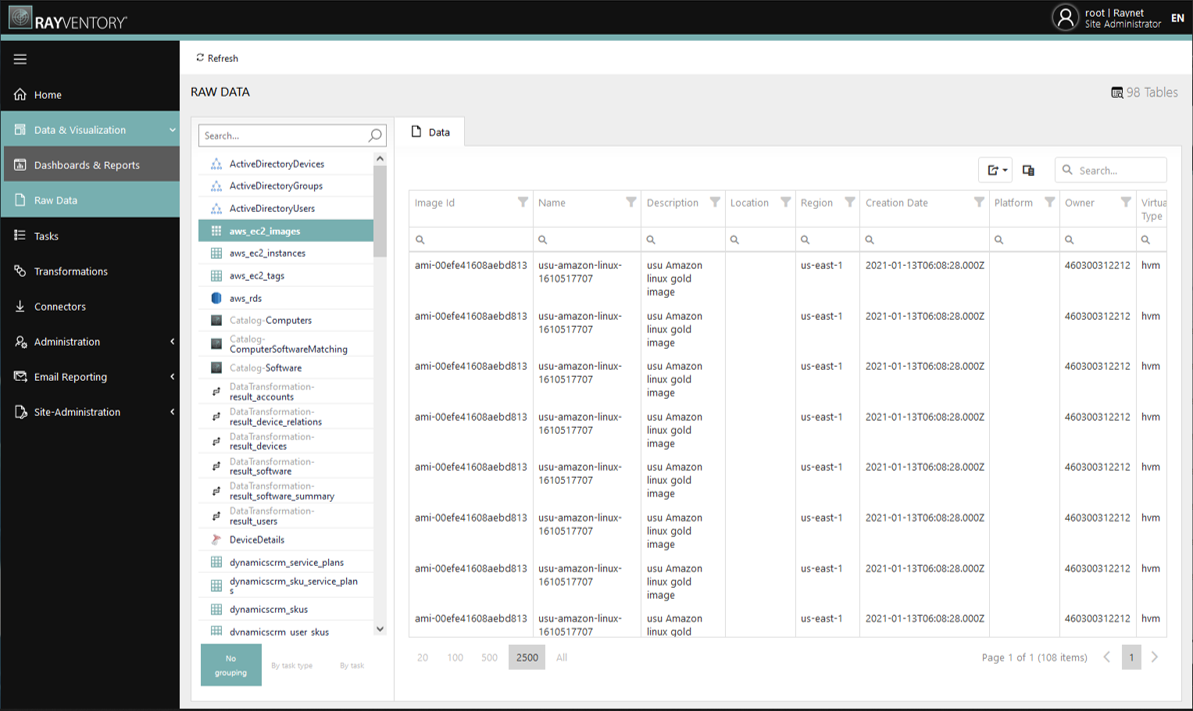
The section is divided into two different areas. The first area contains the table list. If a table has been selected in the table list, the second area shows the contents of this table. At the top right of the screen the total number of tables contained in the database is shown.
Table List
In the table list, all tables that are available in the database are shown. In order to find a specific table, it is possible to use the search field on top of the list to lower the number of tables that will be shown.
Furthermore, there are three grouping options that can be used for a better overview at the bottom of the list. To activate one of these grouping options, click on the specific field. The following options are available:
No Grouping
If this option is selected, an alphabetical list of tables will be shown, similar like in the SQL Server Management Studio (SSMS). Additionally, an icon taken from the task that created the table or a generic icon if the task is unknown, will be shown next to the table.
By Task Type
If this option is chosen, the tables will be grouped by task type and a header for each of the groups will be shown. The tables themselves will than be shown with generic icons, as the task type icon will already be shown in the header. Example task types would be Microsoft Server, Active Directory, Transformation, etc.).
By Task
If this option is chosen, the tables will be grouped by task and a header for each of the groups will be shown. The tables themselves will than be shown with generic icons, as the tasks icon will already be shown in the header. An example for a task would be Get Active Directory Groups.
Data Section
In the Data section, the content of the selected table is shown. The content can be exported and sorted by multiple means. Specific information can be searched using the Search field and it is also possible to filter the different columns using the filter icon located at the top of each column next to its name. Furthermore the following two options are available as buttons on the top right side of the section:
Export
The Export button can be used to export the data of a table to an excel file. There are two export options available.
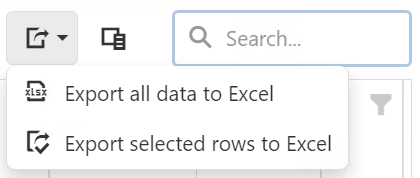
•Export all data to Excel: This option can be used to export the whole table to an excel file.
•Export selected rows to Excel: This option can be used to export the currently selected rows to an Excel file.
The files will be exported as DataGrid.xlsx.
Column Chooser
To open the Column Chooser, click on the Column Choose button located in the upper right corner of the Data section.

By default, the Column Chooser will be empty as all columns of the selected table will be shown. Column can be moved between the data grid and the Column Chooser by using the drag and drop technique. To hide a column, click on it and drag it into the Column Chooser.
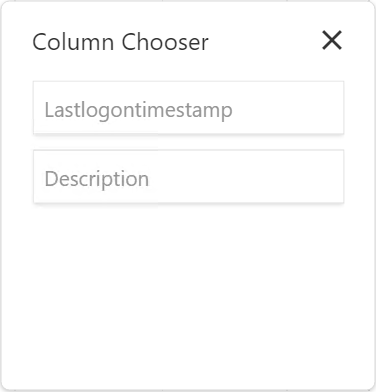
It will now be shown in the Column Chooser and hidden from the data grid in the Data section. To show the column again, click on the column in the Column Chooser and drag it to the data grid. It will be shown in the same location as before.