The library provides a structured overview of all folders, reports and dashboards. Here the user can create new folders, reports and dashboards and edit existing ones. Folders are used for personal structuring and grouping of reports and dashboards.
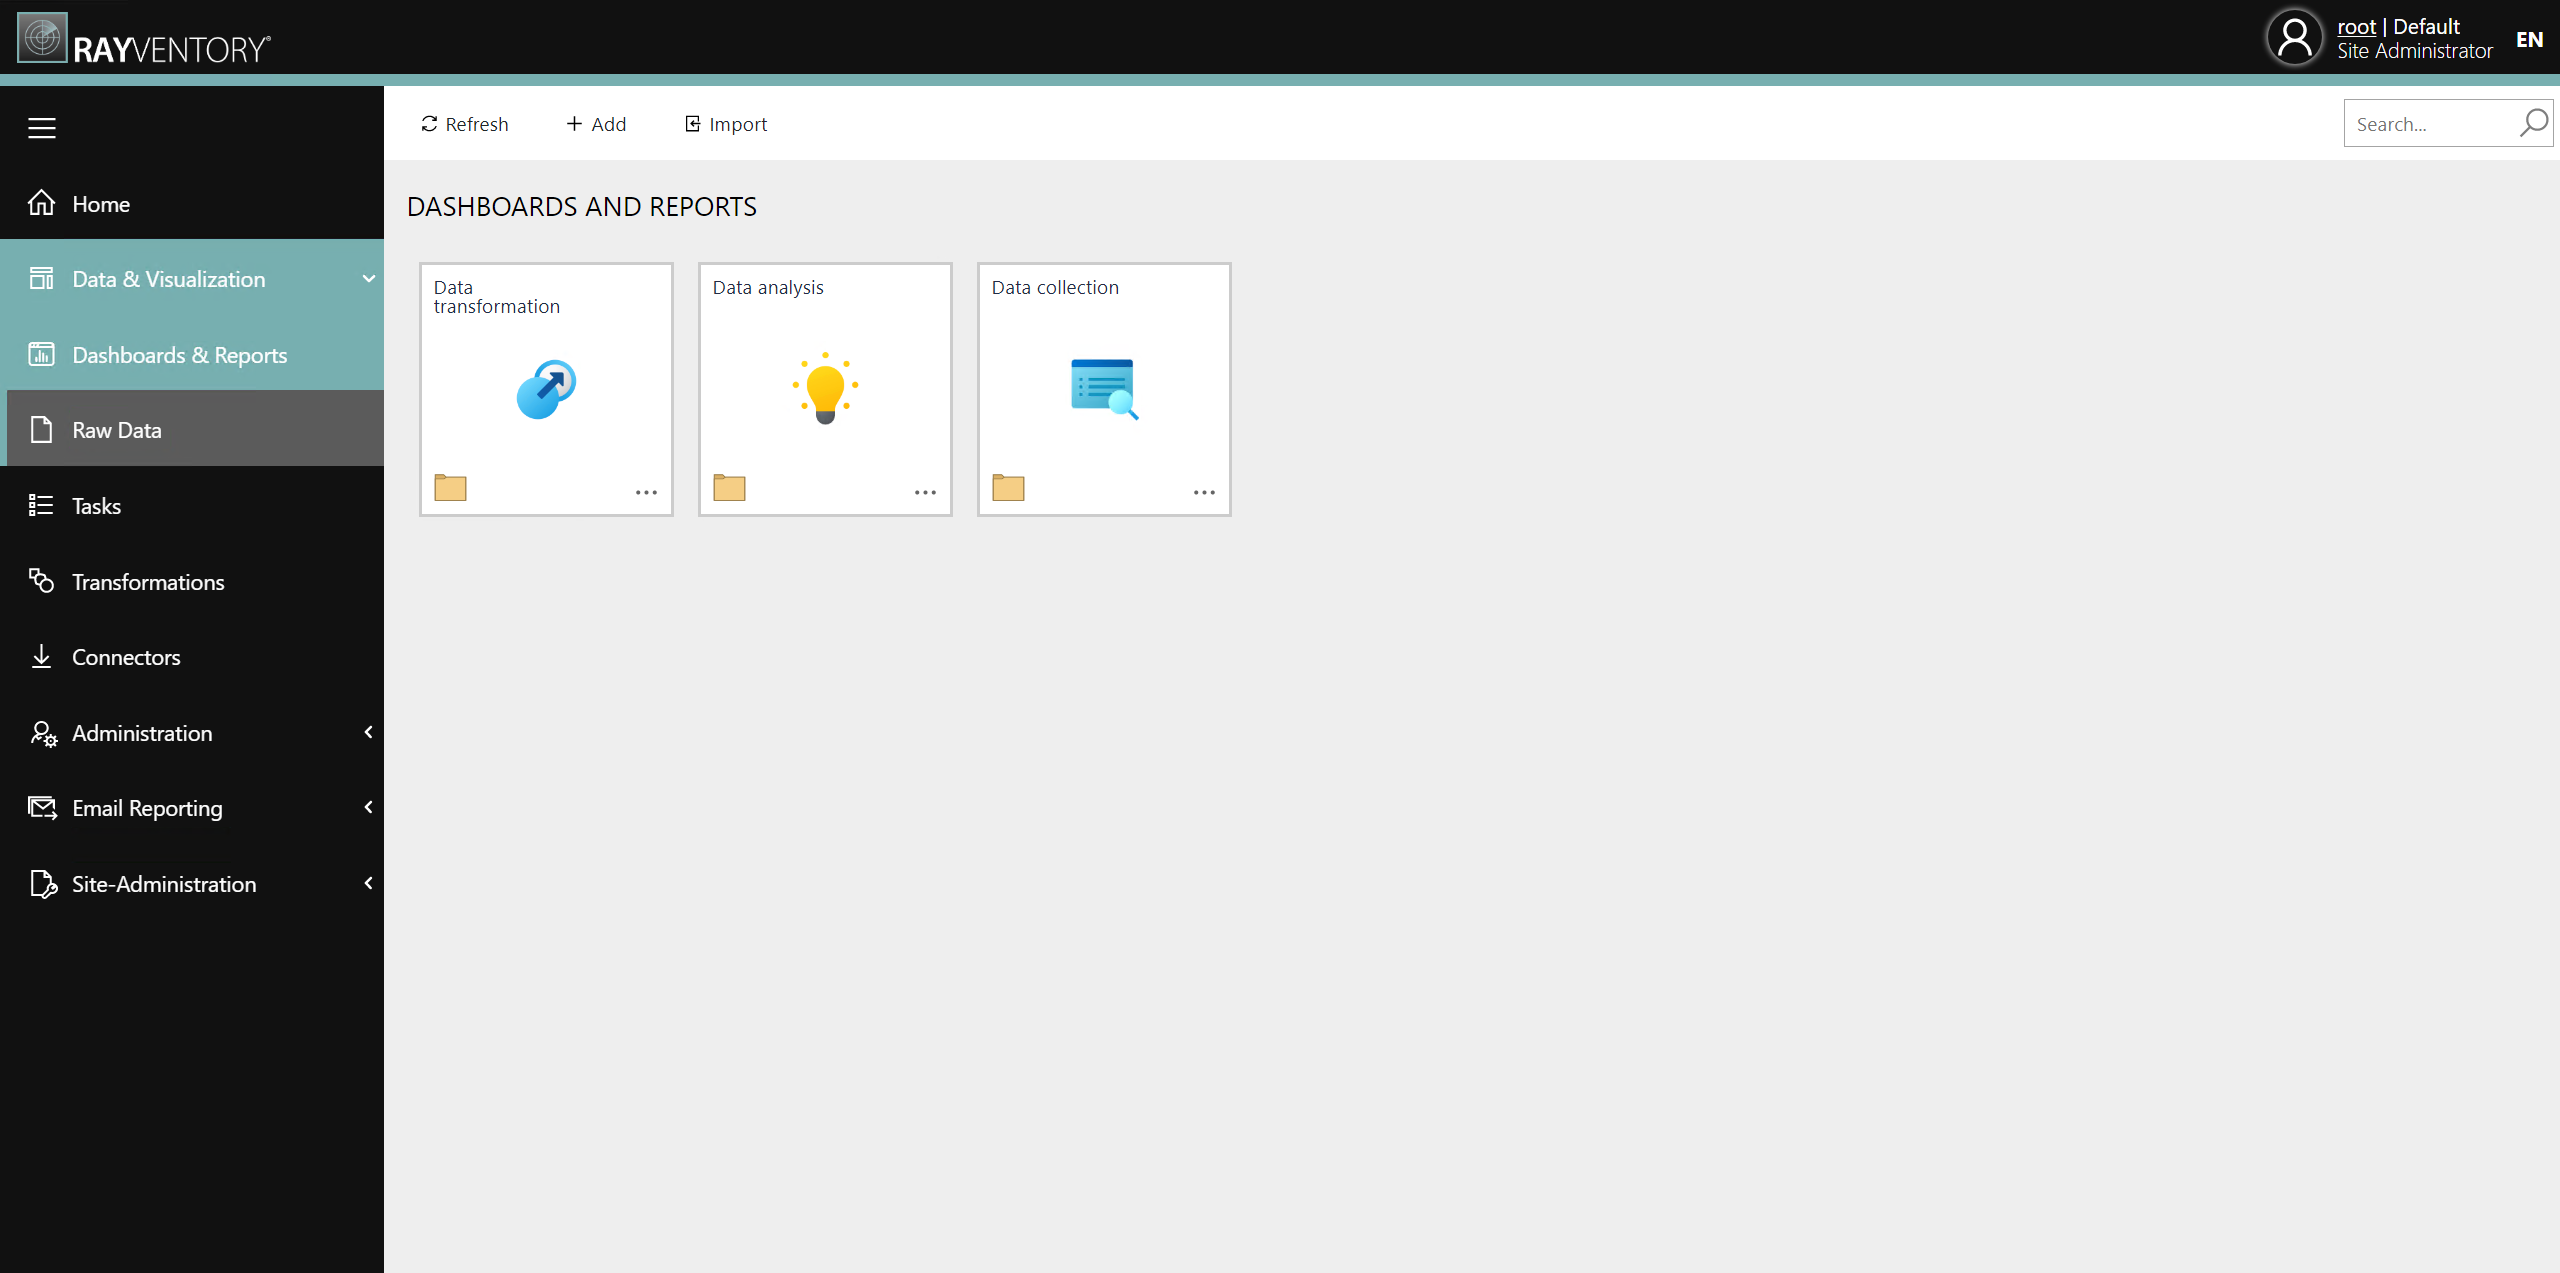
In the top part of each screen, an action bar with function buttons and search input is available. Below the action bar, a breadcrumb with page title is shown - clicking on breadcrumb items triggers navigation between respective areas.
The following function buttons are available in the Library screen:
•Refresh
Reloads all items of the current Section.
•Add
Opens the Editor to create a new folder, report, or dashboard.
•Import
Opens the import-editor that allows to import previously exported reports and dashboards. Please refer to the section Importing a Library Item for more details.
•Search bar
Global search of sections, reports and dashboards by name.
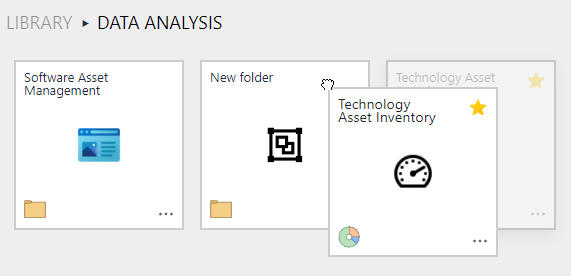
Each folder, dashboard and report is represented as a tile, hereinafter referred to as Library Item. The name is displayed in the upper area and in the center the icon. Any logo in .gif, .jpg, .jpeg, or .png format with a maximum file size of 400 KB can be used.
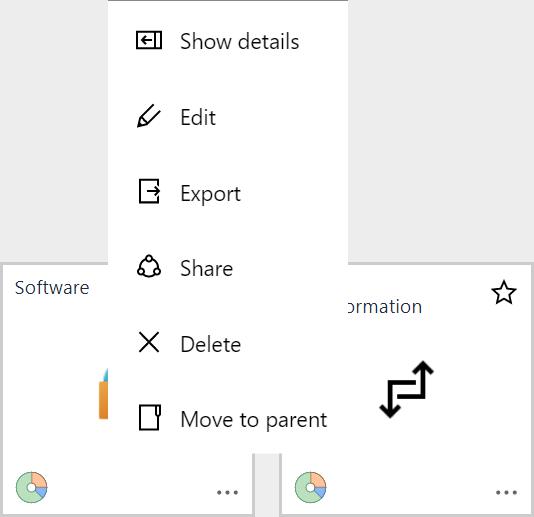
Three dots in the the lower right corner represent a drop down menu. This menu has five actions:
•Show details
Navigates to the detail view of the library item.
•Edit
Navigates to the detail view and opens the editing panel.
•Export
Navigates to the detail view and opens the export panel.
•Share
Navigates to the detail view of the library item and opens the sharing panel.
•Delete
Deletes the library item. The user is prompt for confirmation before deletion.
•Move to parent
Moves the item to the parent folder of the current folder.
|
Note: Menu options shown here might vary dependent of the authorization and permission level of the current user. |
Clicking on the tile will have different outcomes dependent on the type of the library item:
•Folder: Drill down to the library items within this section.
•Report: Navigates to the Report Viewer.
•Dashboard: Navigates to the Dashboard Viewer.
Reordering Items
The items can be reordered using drag-and-drop.
Favoring a Report or Dashboard
To add a report or a dashboard to the list of favorite reports and dashboards click on the star in the tile. If there is a white star with a black frame, it is not a favorite. If there is a yellow star, the report or dashboard will be shown in the list.
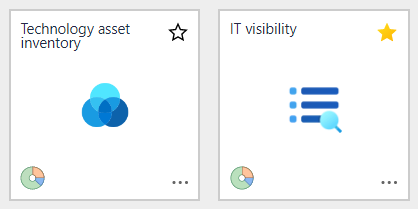
In the example shown in the screenshot, the IT visibility dashboard is marked as a favorite while the Technology asset inventory dashboard is not.
Creating a New Item
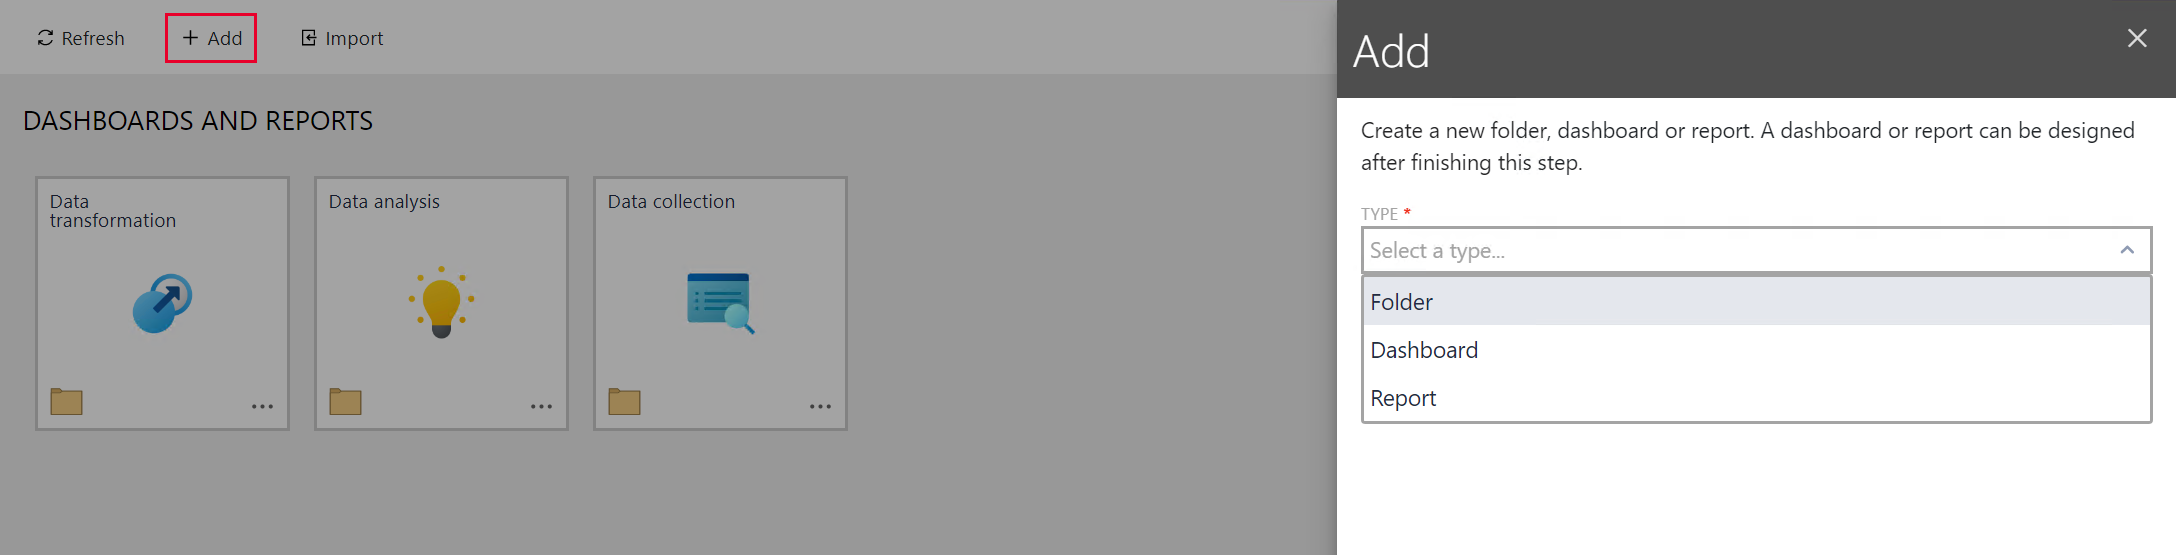
By clicking on the Add button from the actions bar in the library view opens a right side panel showing a form to create a new library item. Fill in the required fields:
•Type – The library item type (Folder, Report or Dashboard)
•Name – Name of the library item
•Icon – (Optional) Upload an icon, which is displayed in the center of the tile
Confirm the inputs by clicking on the button Save changes at the bottom. If the user is successfully created, a green toast notification is displayed in the top right corner.
If any error occurs, e.g. not all mandatory fields were filled or a field requires a unique name, a red pop-up notification is shown with further information. Furthermore, any invalid input field is marked with a red border and displays a short error message below the input field.
Reports and Dashboard Details
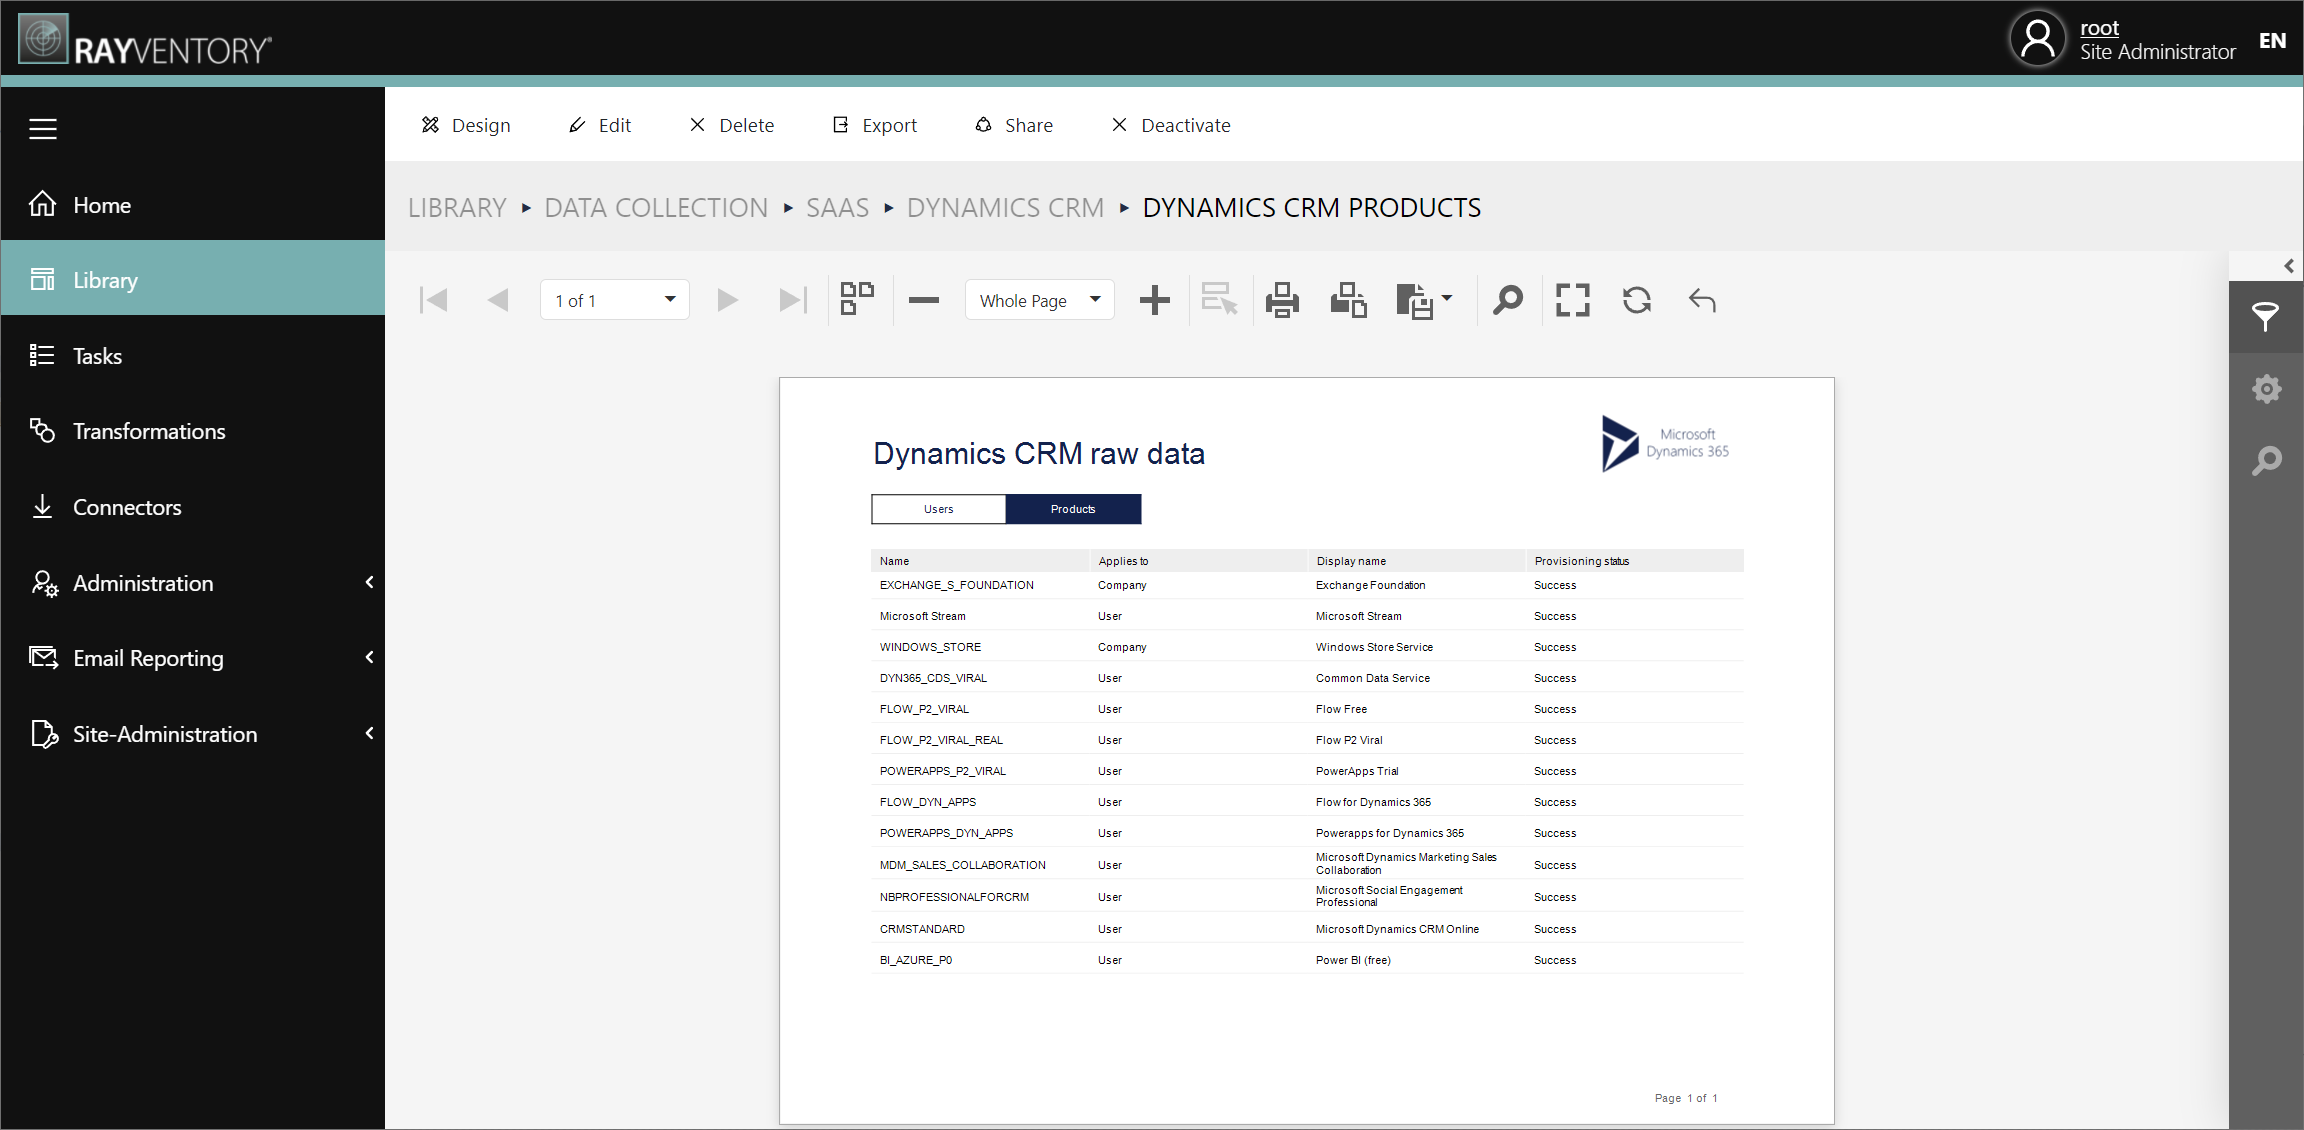
The action bar directly above the report has the following actions:
•Design - Switches the current view to the "designer" mode, in which it is possible to change, add or remove elements to the canvas.
•Edit - Opens the Edit panel that allows to edit the name, logo and mark the report as "featured".
•Delete - Deletes the current library item. This operation is irreversible.
•Export – Opens the Export panel showing a form to export the library item. Please refer to the section Exporting a Library Item for more details.
•Share - Opens the Share panel showing a form to create a sharable link of the library item.
•Deactivate – Deactivates the current item. This means that no user who does not have the Data admin or Administrator role can see or edit this library item, regardless of the permission set in the group the user is in. This button is only visible when the Library item is currently active.
•Enable – Activates the Library item again. This means that any user can see or edit this library item, dependent of the permission set in the group the user is in. This button is only visible when the Library item is currently deactivated
|
Note: Action bar options shown here might vary dependent of the authorization and permission level of the current user. |
Sharing a Library Item
By clicking on the Share button in the library item’s drop down menu or in the actions bar at the library details view opens a right side panel showing a form to create a new shared link for the selected library item. The share option is only available for reports and dashboards.
For more information about sharing, refer to the following chapter: Sharing reports
Secure link sharing
You can enhance report security by employing "Secured Mode," which imposes additional restrictions on the sharing of reports, particularly those with customized parameters. It's important to note that "Secured Mode" is primarily intended for reports with defined parameters, and it won't affect reports without parameterization. For comprehensive insights into parameters, please refer to the XXX section.
Exporting and Importing
See the chapter Importing and exporting for an overview of import and export capabilities of report and dashboard definitions.