The Web Dashboard allows you to bind various dashboard items to data in a virtually uniform manner. To learn more, see the Bind Dashboard Items to Data topic.
The only difference is in the data sections that the required dashboard item has. This topic describes how to bind a Sankey dashboard item to data.
Binding to Data in the Web Dashboard
The image below shows a sample Sankey dashboard item that is bound to data.
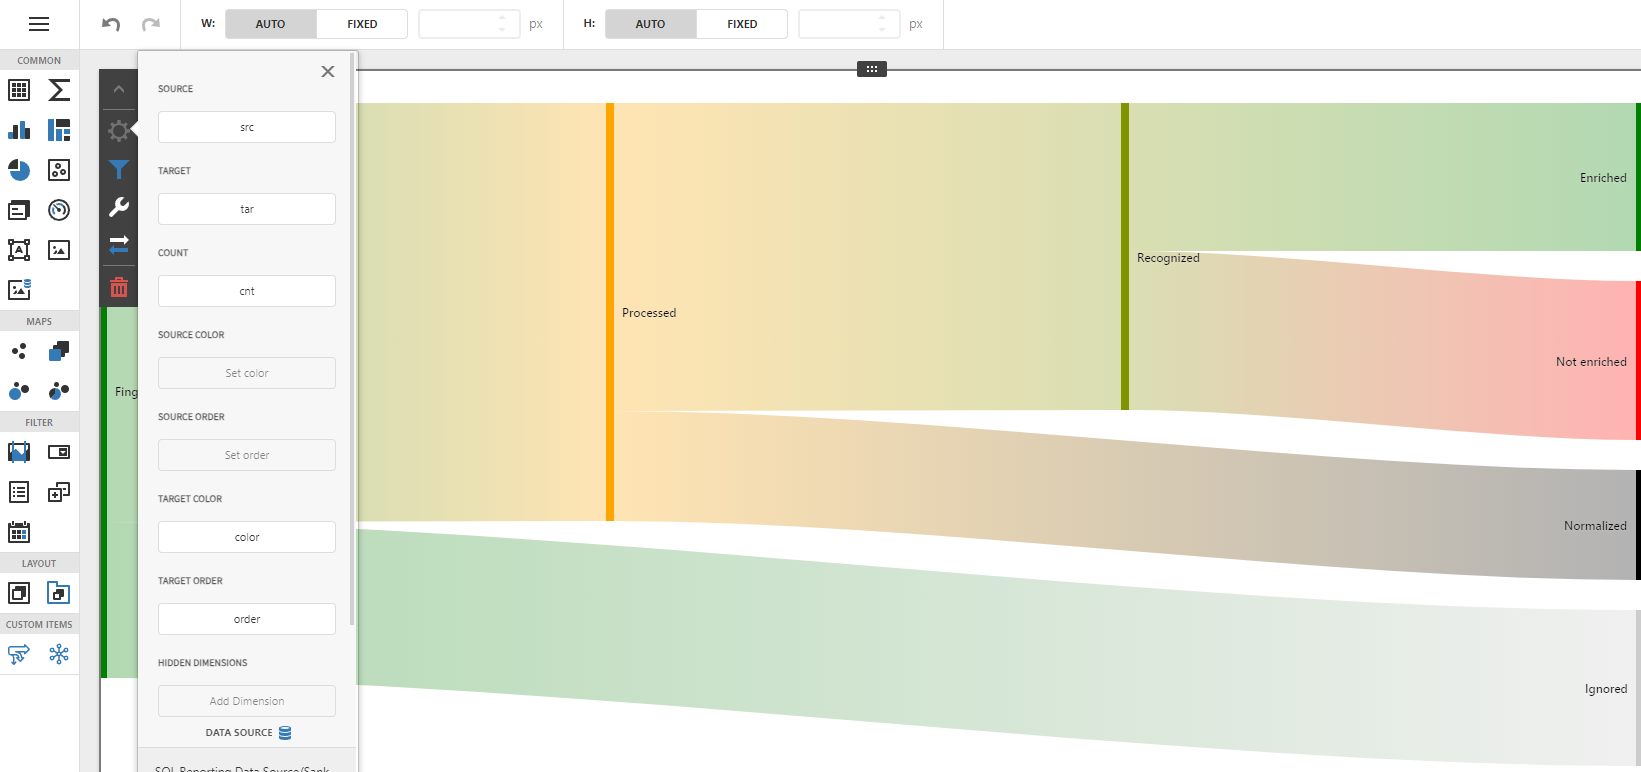
To bind the Sankey dashboard item to data, click a placeholder contained in one of the available data sections and select the required data source field in the Binding section of the invoked data item menu.
The table below lists and describes the Range Filter's data sections.
Section |
Processed as |
Description |
Source |
Dimension |
Contains label elements for sources (incomes) |
Target |
Dimension |
Contains label elements for targets (outcomes) |
Count |
Measure |
Contains a numeric value, representing the flow amount |
Source color |
Measure |
Binding to the color, representing the incoming node |
Target color |
Measure |
Binding to the color, representing the outcome node |
Source order |
Measure |
The numeric order used to sort the source items. |
Target order |
Measure |
The numeric order used to sort the target items. |