The Web Dashboard allows you to bind various dashboard items to data in a virtually uniform manner. To learn more, see the Bind Dashboard Items to Data topic.
The only difference is in the data sections that the required dashboard item has. This topic describes how to bind a Network dashboard item to data.
Binding to Data in the Web Dashboard
The image below shows a sample Network dashboard item that is bound to data.
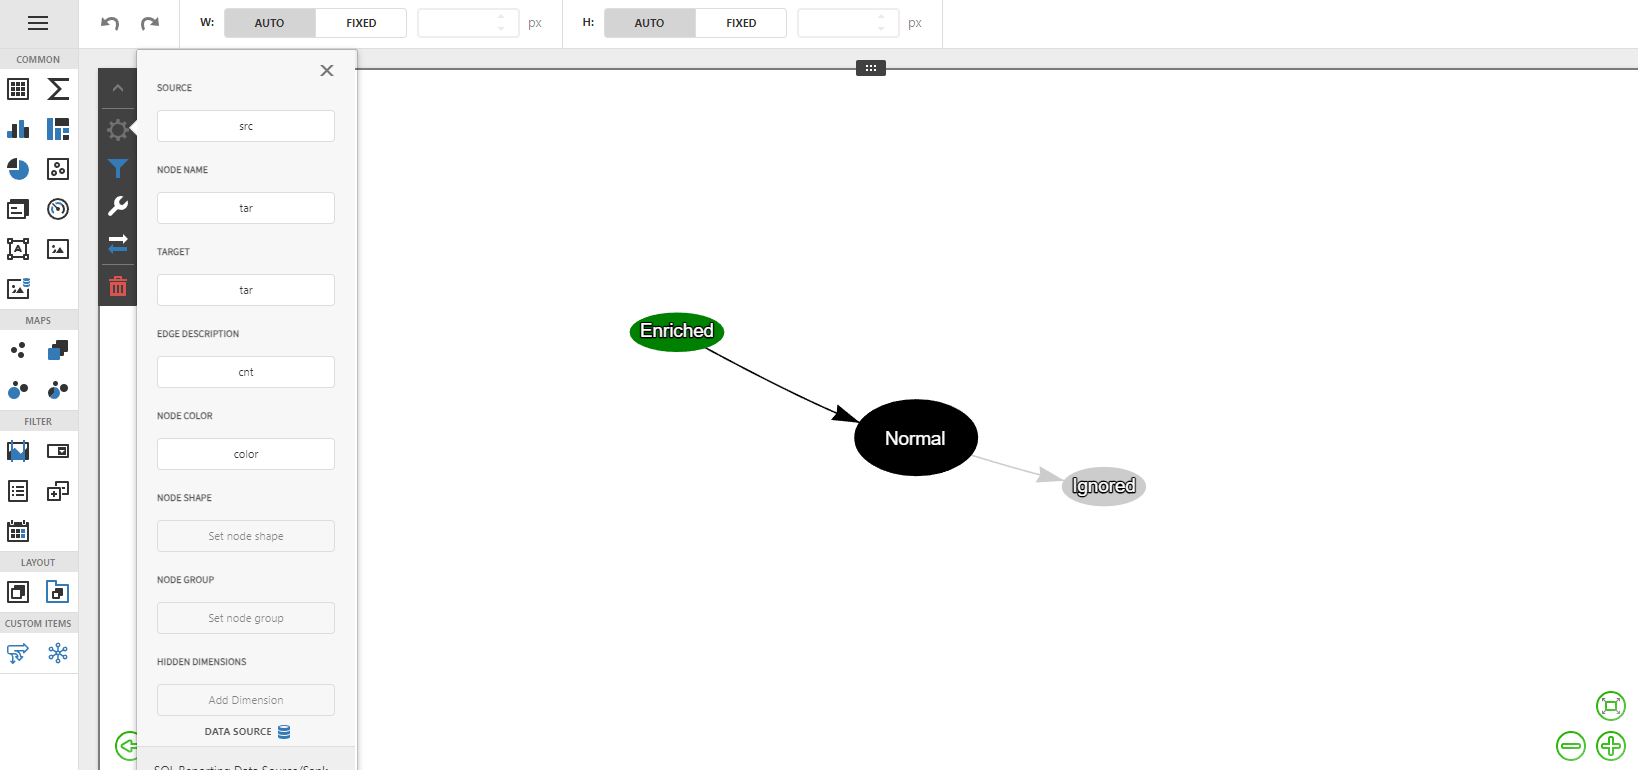
To bind the Sankey dashboard item to data, click a placeholder contained in one of the available data sections and select the required data source field in the Binding section of the invoked data item menu.
The table below lists and describes the Range Filter's data sections.
Section |
Processed as |
Description |
Source |
Dimension |
The source name |
Node name |
Dimension |
The node name |
Target |
Dimension |
The target name |
Edge description |
Measure |
The description of an edge |
Node color |
Measure |
The color of an edge |
Node shape |
Measure |
The name of the shape to use. Sample supported values are star, triangle, square, database, dot, hexagon. A more complete list of supported shapes can be found online: https://visjs.github.io/vis-network/examples/network/nodeStyles/shapes.html |
Node group |
Measure |
A name used to group nodes |