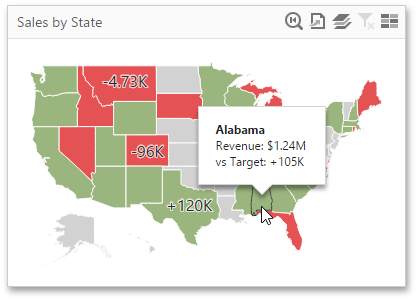
The Choropleth Map allows you to indicate the difference between the actual and target values of a particular parameter. This difference is called delta.
By default, map shapes are colored depending on the values provided. If you add an additional target value to create delta, the coloring of map shapes depends on the difference between two values.

Add Delta
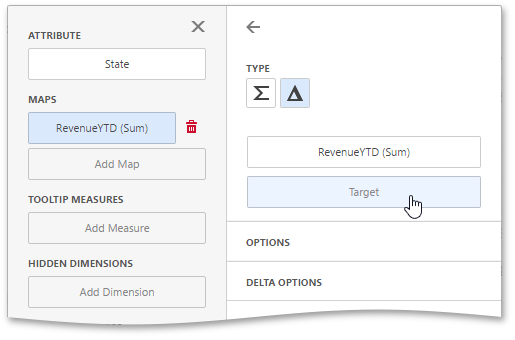
Delta is bound to two measures that provide two values: the Actual value and the Target value. The difference between these values is displayed on the map.
When you switch the map type to Delta, a new Target data item container appears.

Click it to open the target data item menu and provide data for the target value.
Delta Options
To specify delta indication settings, go to the Delta Options section of the data item menu. Here you can specify the delta display mode (e.g., value or bar), value type, result indication, comparison tolerance, etc.
The following options are available.
Option |
Description |
Value Type |
Specifies which values to display within map tooltips as the delta value. |
Result Indication |
Specifies the condition that will be used to select the indicator color. |
Threshold Type |
Specifies the comparison tolerance in percentage values or in absolute values. You can specify that a required indicator should only be displayed when the difference between the actual and target values exceeds a specified value. |
Threshold Value |
Specifies the comparison tolerance value. |