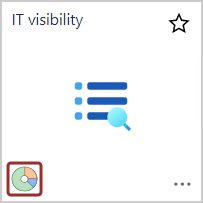
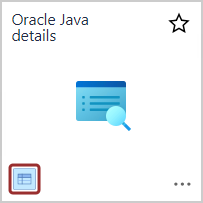
Raynet One Data Hub provides two basic types of reporting objects which can be used for data visualization:

On the Dashboards & Reports page, Dashboards and Reports can be distinguished by the icon in the bottom left corner of the item.
Dashboards

Dasbhoards are highly interactive, customizable, web-oriented controls, which aggregate the data and visualize them in a touch-friendly way. A dashboard usually takes the full width and height of the current view port. The current view port is not scrollable, which means that all controls, tables and other widgets must fit. More data can be shown in tabs, or in separate containers, where local scrolling is enabled.
Depending on the dashboard configuration, some advanced scenario like master-child patterns, filtering, selection etc. are supported. Most of the dashboards provide at least some basic level of interactivity, supporting mouse clicks, drag-and-drop, touch etc.
The primary goal of a dashboard is to visualize the data on a computer monitor or on a hand-held device screen. They are usually less suited for printing, where Reports are a better choice.
Reports

Reports are the static counterpart of dashboards. They are usually meant to be printed (physically or to a PDF/XPS format) and most of them consist of large tabular data and charts. Since the reports have been optimized and are well-suited for documents resembling sheets of paper (for example in A4 format) they contain many options for headers, pages, and fixed page elements.
Some limited interactivity is still possible, for example a report may support customizing the data sets and/or data shaping via input parameters. These - when supported - are shown in the web UI and usually have a form of a dropdown or text.
For more information on how to handle dashboards and reports, refer to the Dashboard & Reports section. Continue to Getting Started with IT Visibility in order to configure and use a first Dashboard in Raynet One Data Hub.