The following examples illustrate typical scenarios in which AI Chat analyzes data from the Raynet One inventory and generates visual insights. These use cases demonstrate how natural language queries can be used to explore system data, identify patterns, and support decision-making through charts, tables, and summarized metrics.
1. Operating System Distribution
Example Question:
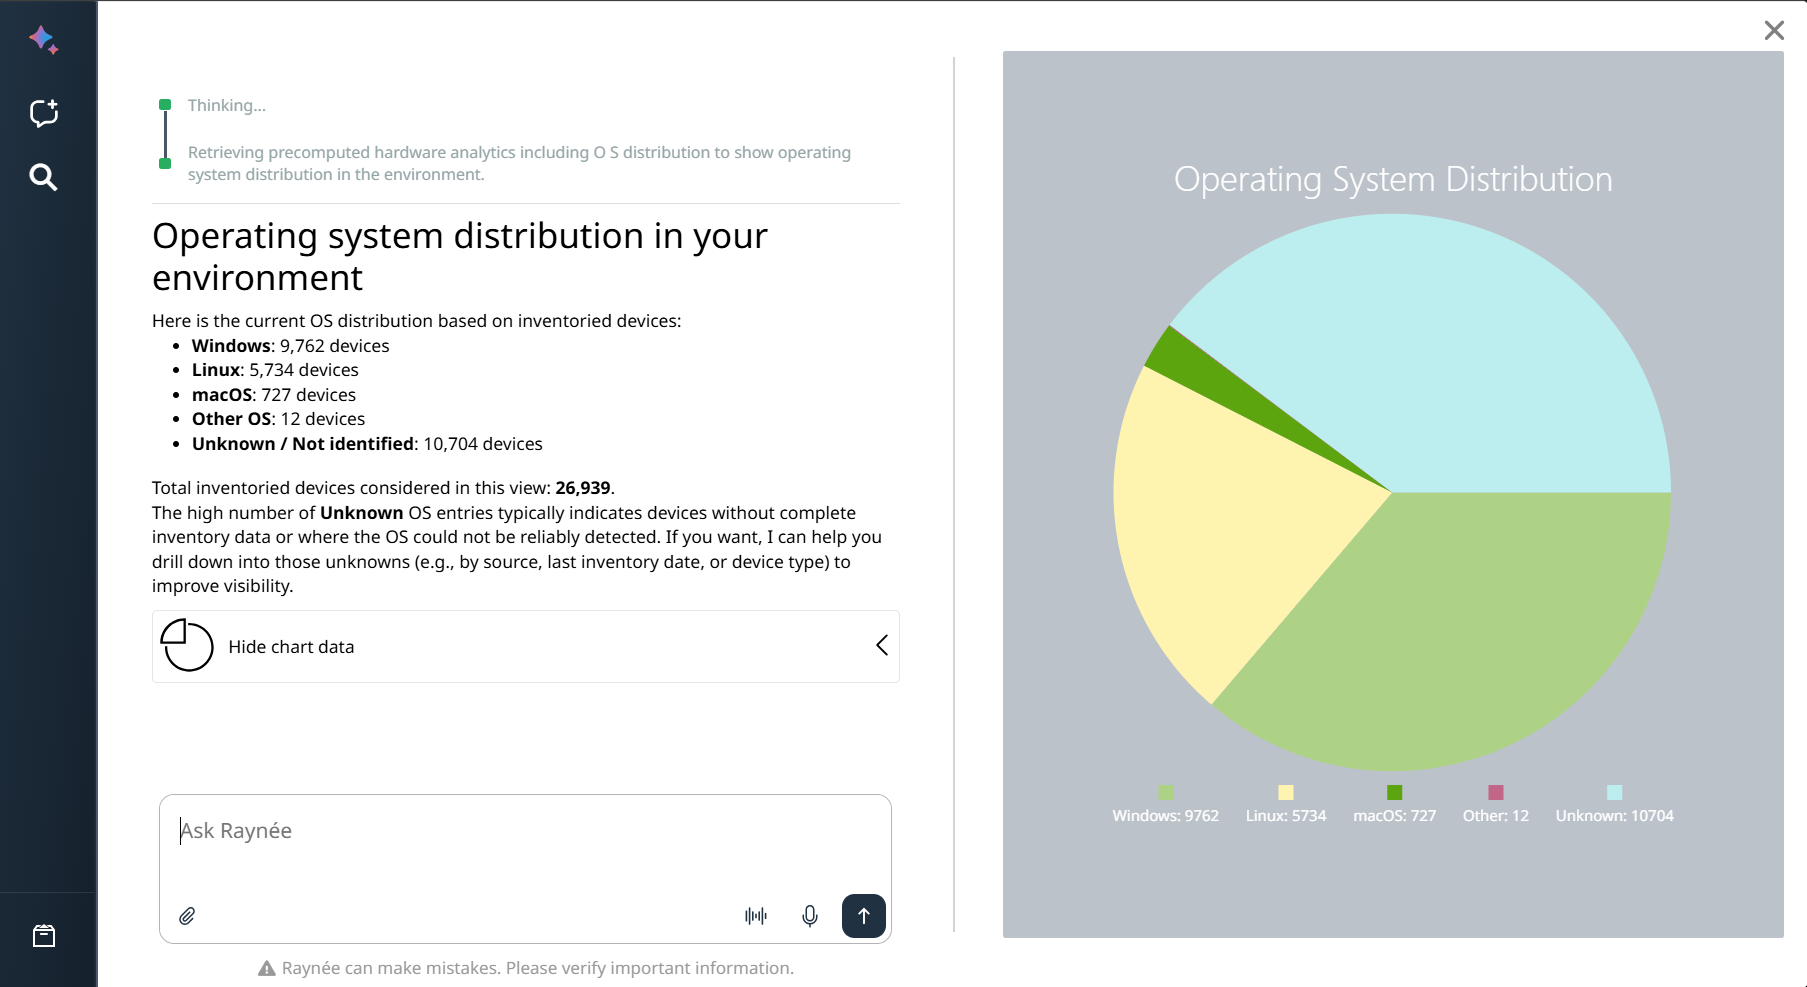
Show me the distribution of operating systems across all devices in my environment.
AI Chat Output:
Summary of total devices with breakdown by operating system family (e.g., Windows, Linux, macOS, Other, Unknown).
Visualizations:
•Pie chart showing the percentage distribution of OS families.
•Optional: Detailed table with device counts and percentage share per OS family.
Value:
•Immediate overview of the current technology landscape.
•Clear identification of dominant platforms and potential modernization gaps (e.g., high share of Unknown or legacy systems).
•Solid foundation for upgrade planning and risk assessment.
2. Software Usage & License Insights
Example Question:
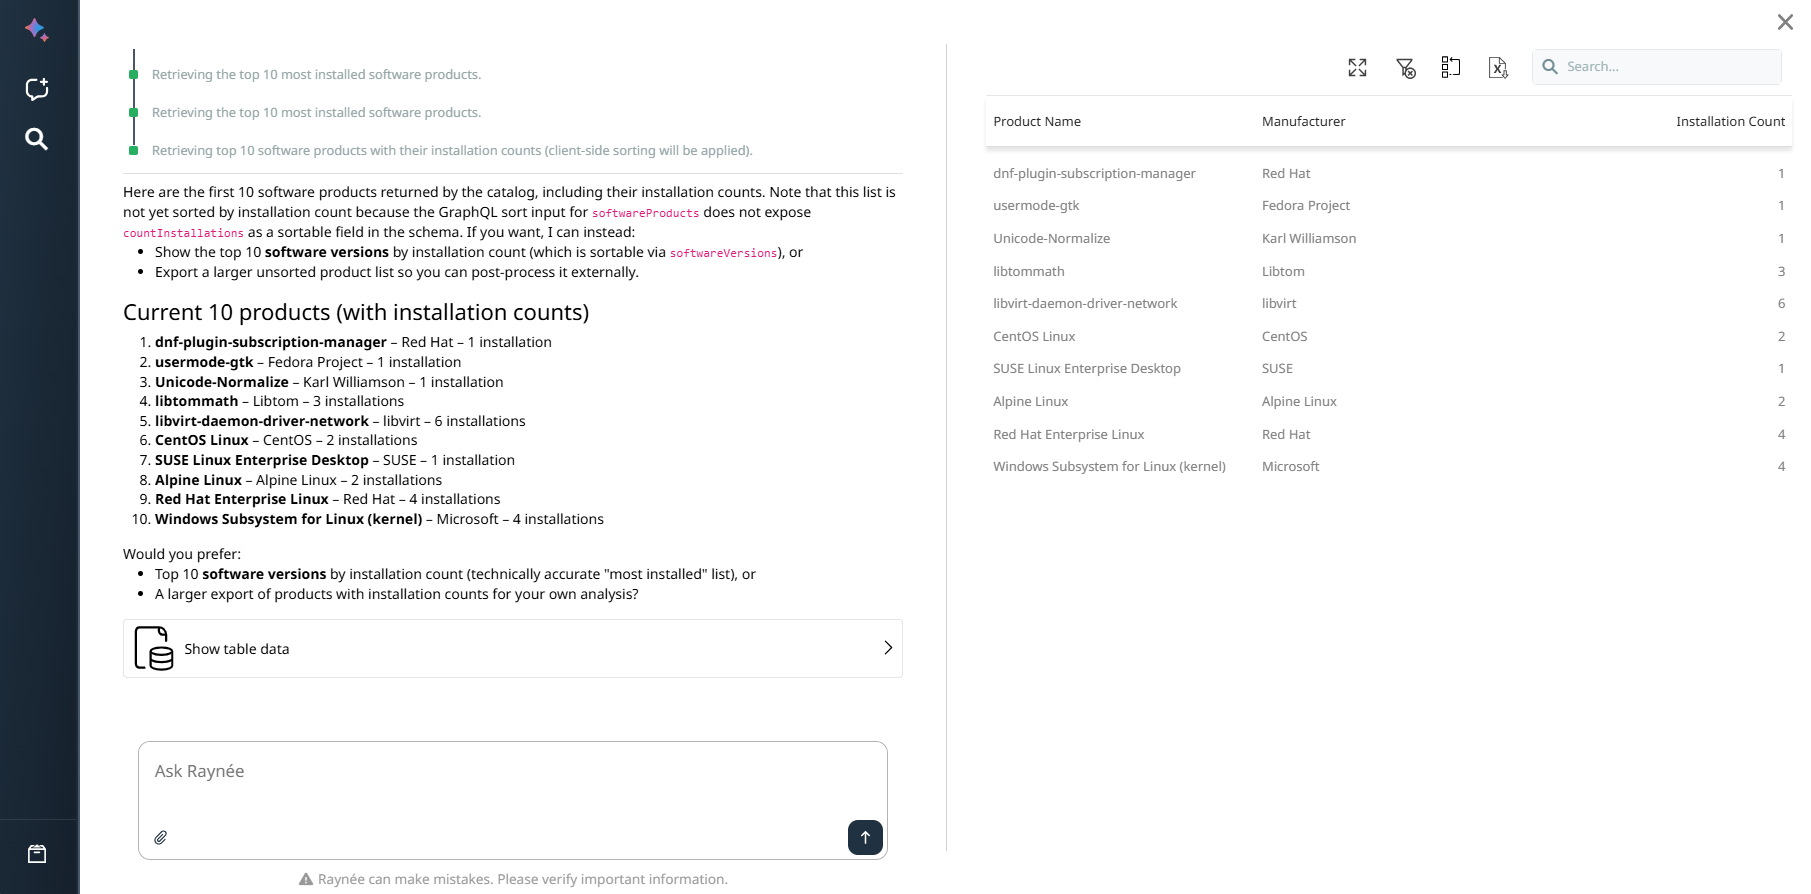
Show me the top 10 most installed software products in my environment, including installation counts.
AI Chat Output:
Ranked list of the top 10 software products by number of installations.
Visualizations:
Table with columns: Product Name, Manufacturer, Installation Count.
Value:
•Fast identification of frequently used and business-critical applications.
•Detection of shadow IT and redundant software.
•Data-driven foundation for license optimization and cost control.
3. Vulnerability Criticality Distribution
Example Question:
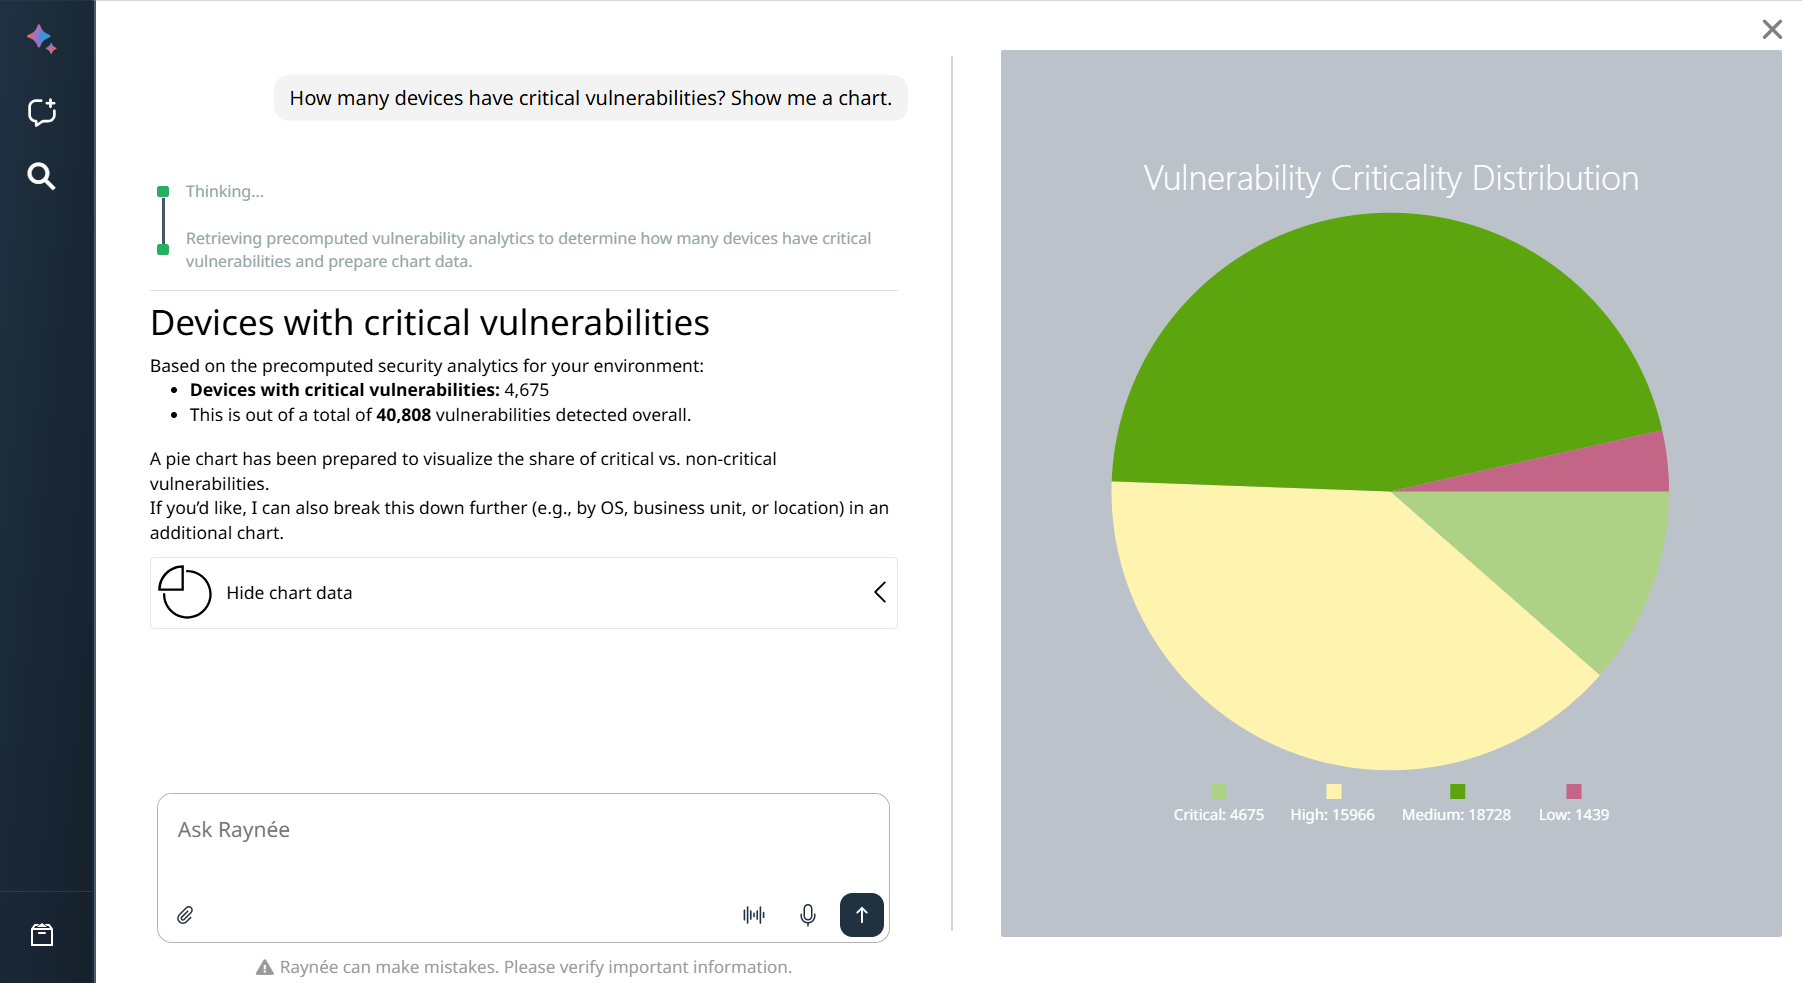
How many devices have critical vulnerabilities? Show me a chart.
AI Chat Output:
Categorized breakdown of vulnerabilities by severity level (Critical, High, Medium, Low) with exact device counts per category.
Visualizations:
•Bar chart, pie chart, or stacked visualization showing the distribution of vulnerability severity levels across the environment.
•Optional highlighting of the most affected products or device groups.
Value:
•Instant visibility into current security risks and vulnerability exposure.
•Clear prioritization of remediation efforts based on severity and affected device volume.
•Professional support for security reporting and compliance audits.
4. License Compliance Analysis using Contract Data (SAMCloud)
Example Question:
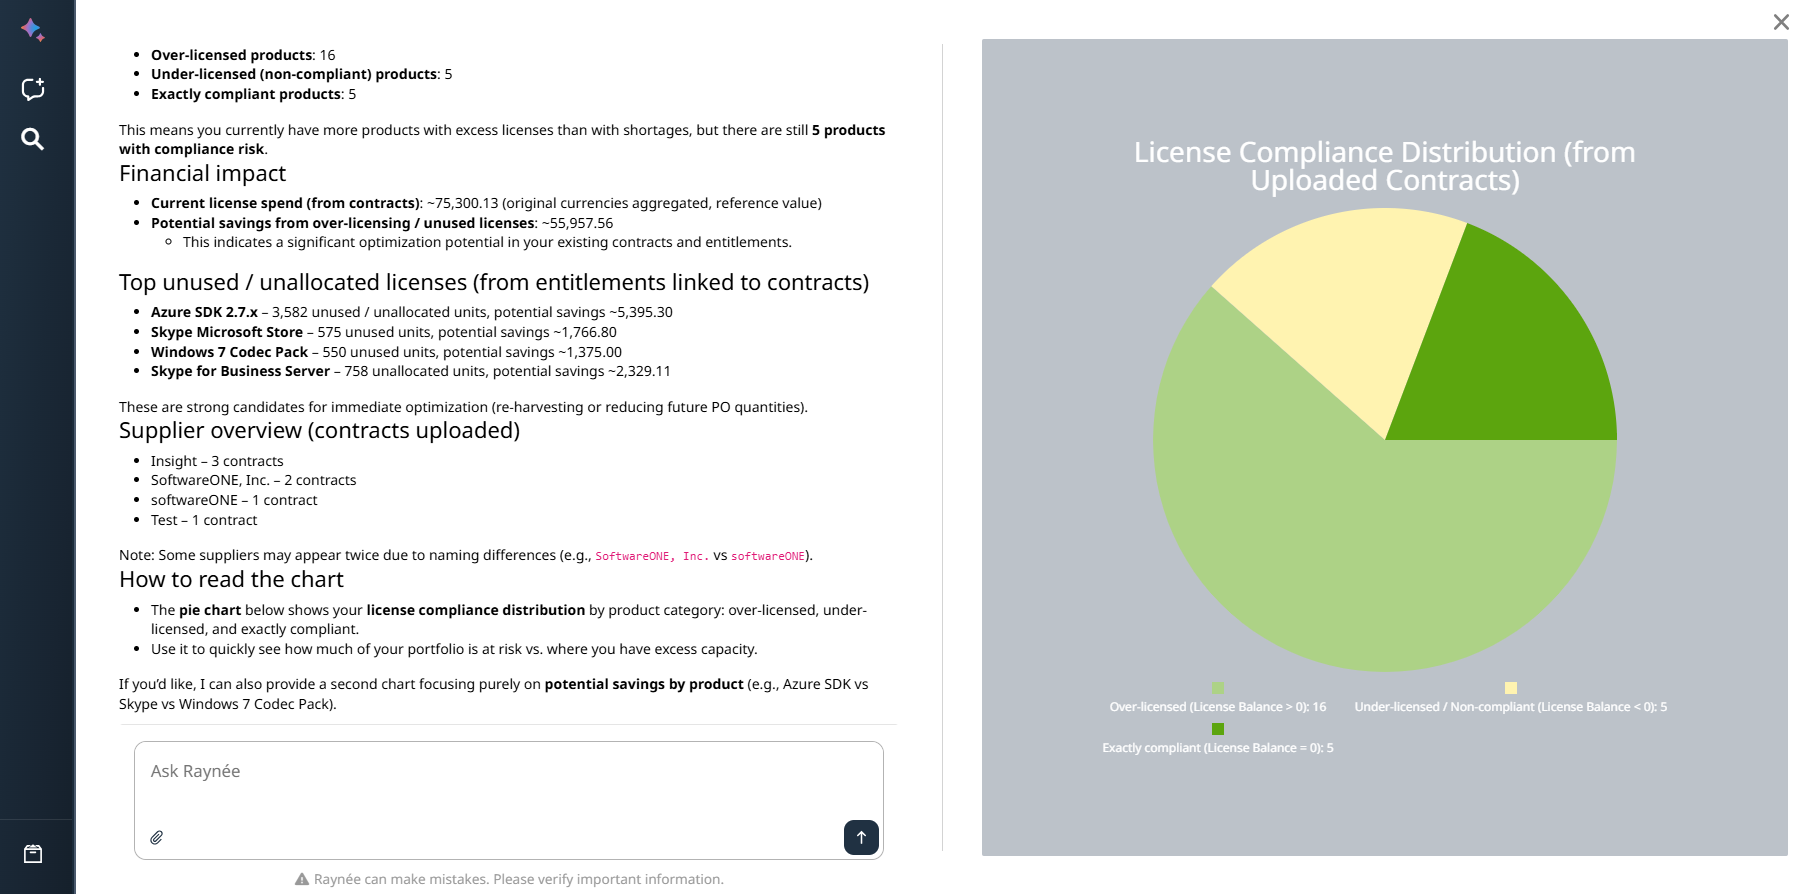
Summarize the licenses extracted from uploaded contracts and highlight potential optimization opportunities.
AI Chat Output:
Overview of license compliance based on uploaded contracts.
Visualizations:
Pie chart showing three categories:
•Over-licensed (License Balance > 0)
•Under-licensed / Non-compliant (License Balance < 0)
•Exactly compliant (License Balance = 0)
Value:
•Faster contract review and reconciliation.
•AI-supported compliance checks with reduced manual effort.
•Early detection of risks and cost-saving opportunities before audits.
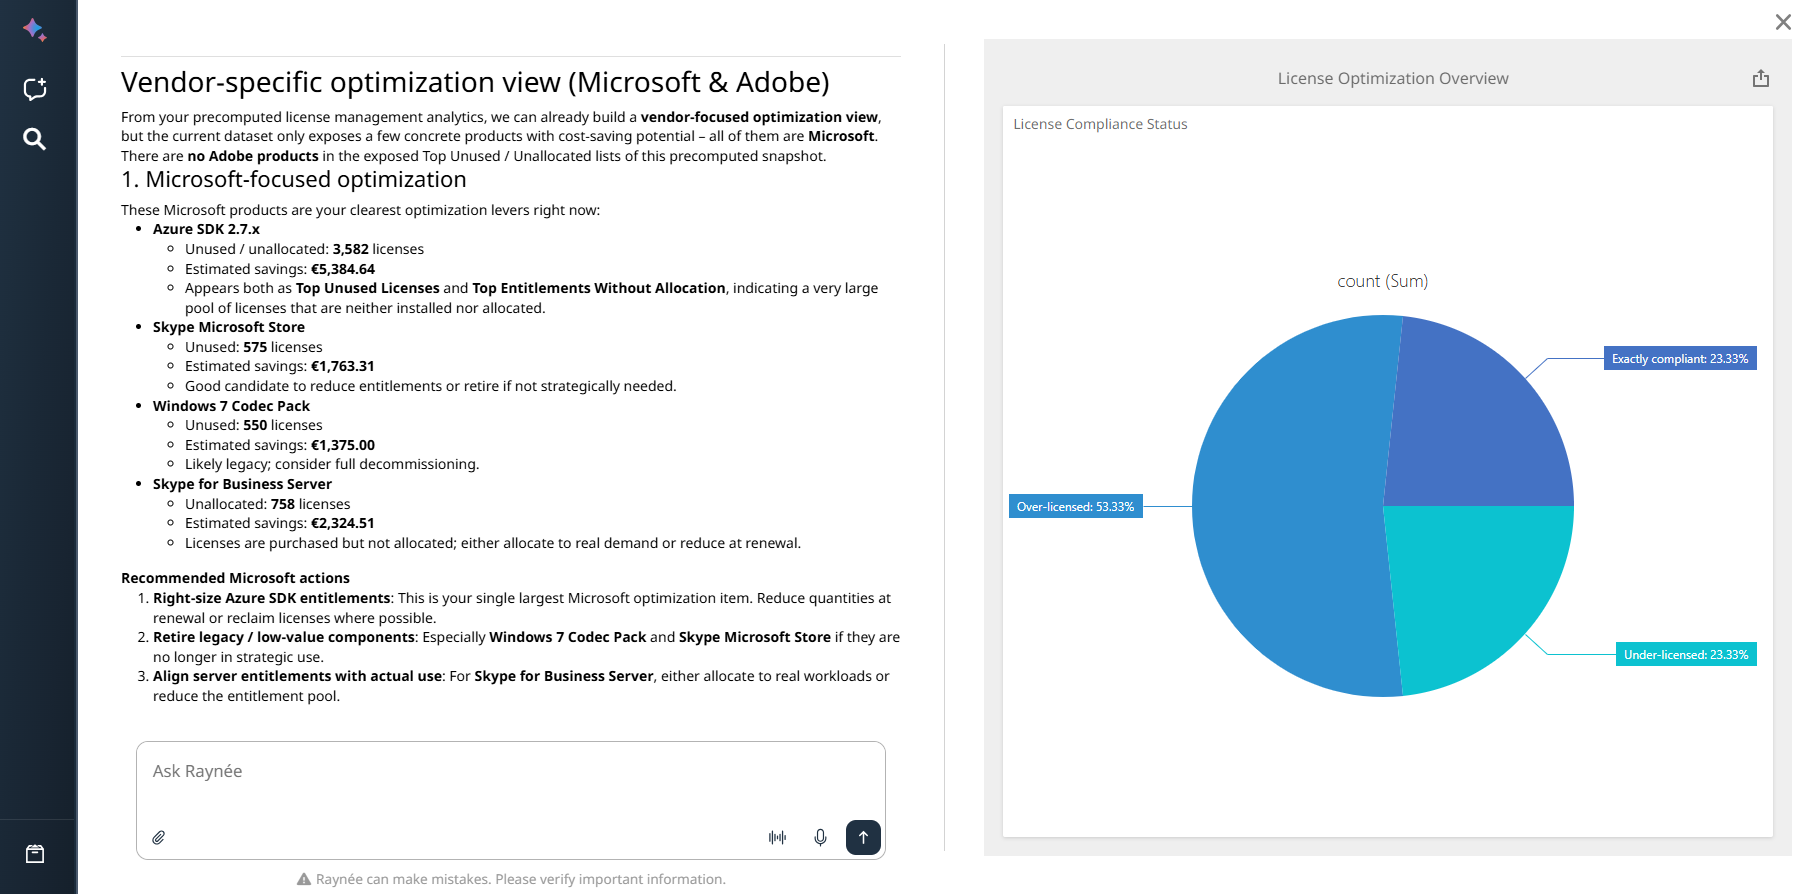
5. License Optimization Analysis
Example Question:
Analyze my software inventory and identify products that are over-licensed or under-licensed.
Show the results as a chart and highlight the top optimization opportunities including estimated cost savings.
AI Chat Output:
Overview of license compliance across installed software products.
Visualizations:
•Chart showing license compliance categories: Over-licensed, Under-licensed, and Exactly compliant software.
•Detailed optimization recommendations including vendor information, unused or unallocated licenses, estimated cost savings, and specific actions (e.g., right-size entitlements, retire legacy products, or consider full decommissioning).
•Recommended actions for major vendors such as Microsoft.
Value:
•Immediate visibility into license compliance status.
•Identification of unused licenses and potential cost savings.
•Support for license optimization and improved audit readiness.
The prompt below initiates the license optimization analysis. The chart shown in the example was generated during the subsequent conversation with AI Chat as the analysis was refined.
These examples illustrate how AI Chat can transform natural language queries into actionable insights by analyzing inventory, security, and license data.