The Job list is a helpful tool to monitor platform operations and to check on your data management - provided that you know how to "read" the information it has in store for you. In this chapter, you will get familiar with the most important tools for job analysis. Please note that all of the following steps are optional. In this case, the description follows the chronology of available tabs. This chronology is not mandatory, though. Generally, in order to access the job details view, you must navigate to the Job list and select a list entry as explained before.
Before you start analyzing a specific platform job (usually a discovery or inventory run), consider that the Job details view includes five tabs: Overview, Inventory runs (if the selected job is an inventory, otherwise it is Discovery runs), Staged results, Instruments and Graph.
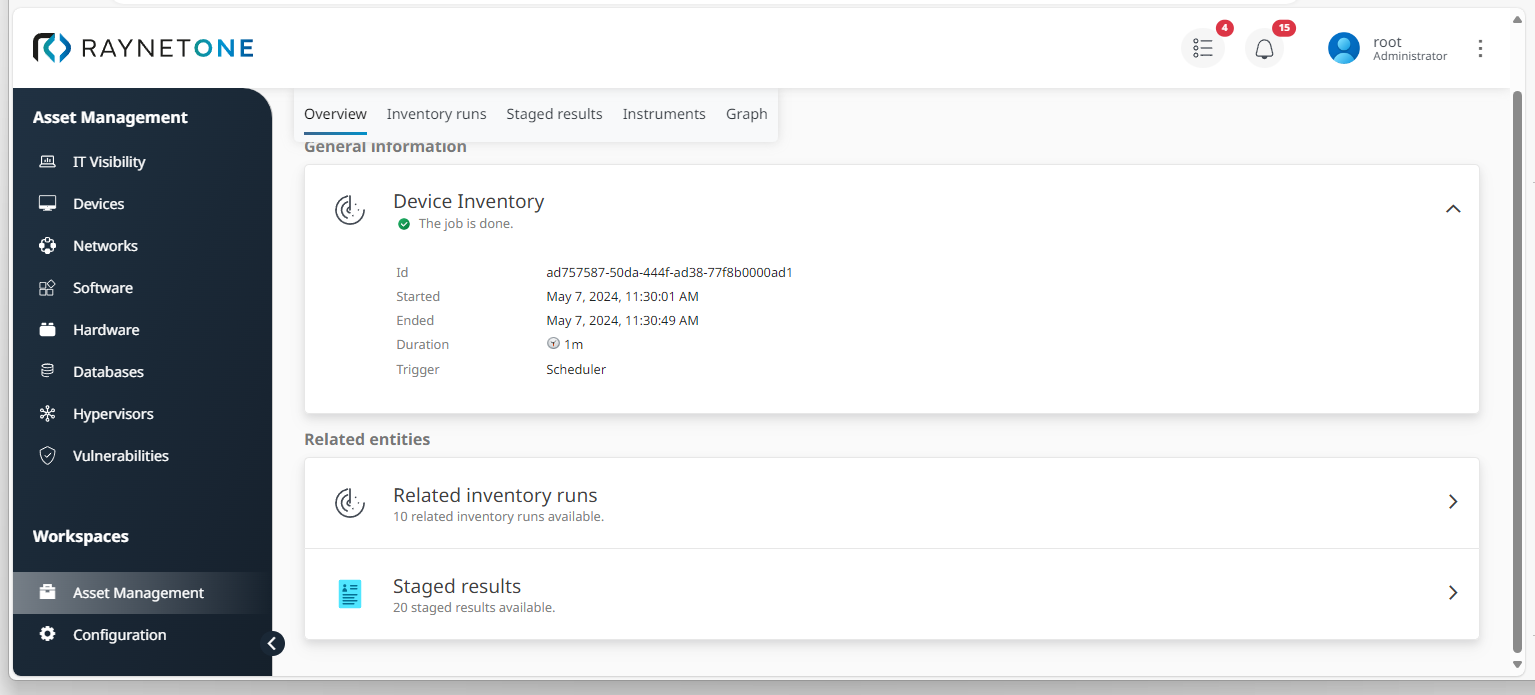
1.For a first glance, check on the basic operational job details under Overview. From here, you can also directly move on to Related inventory runs and Staged results.
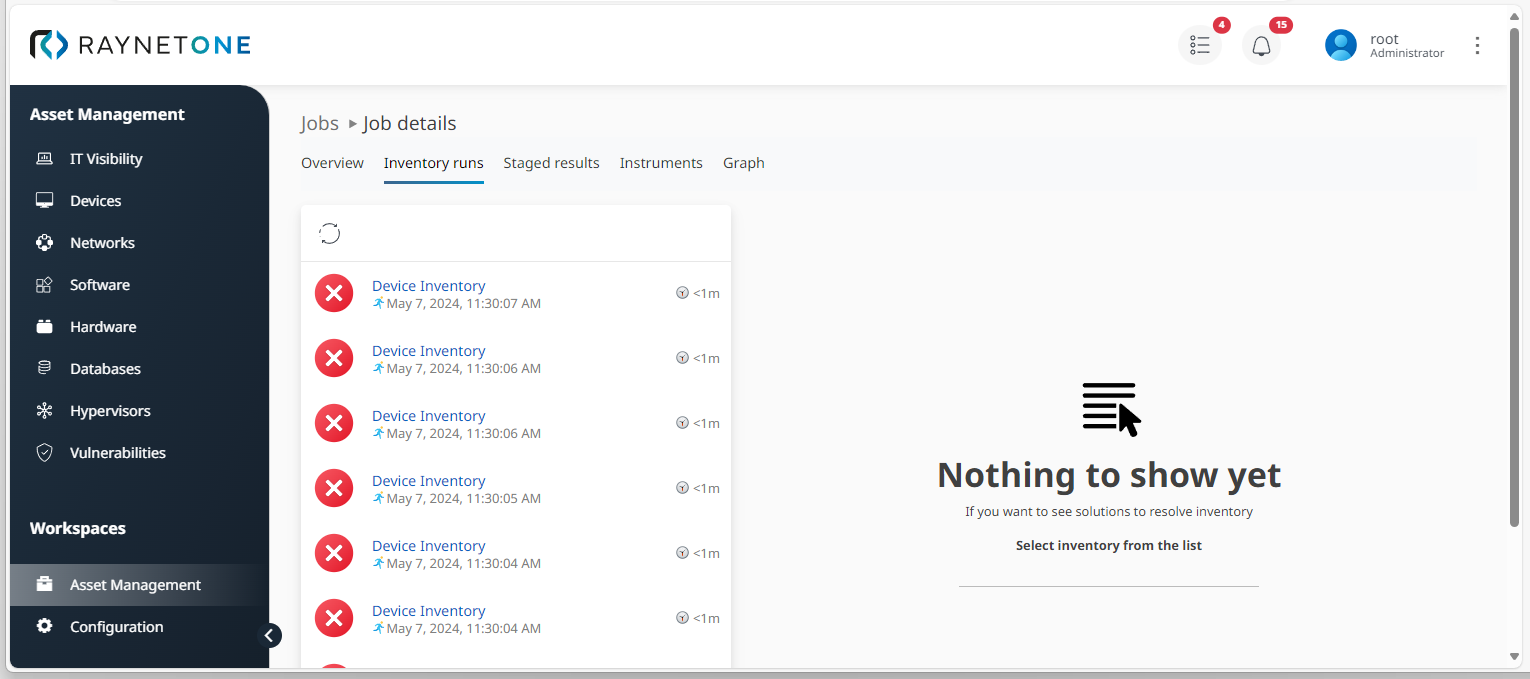
2.View the current status of related jobs under Inventory runs. In this case, there are a number of failed inventory attempts which potentially require troubleshooting, as the red cross item indicates.
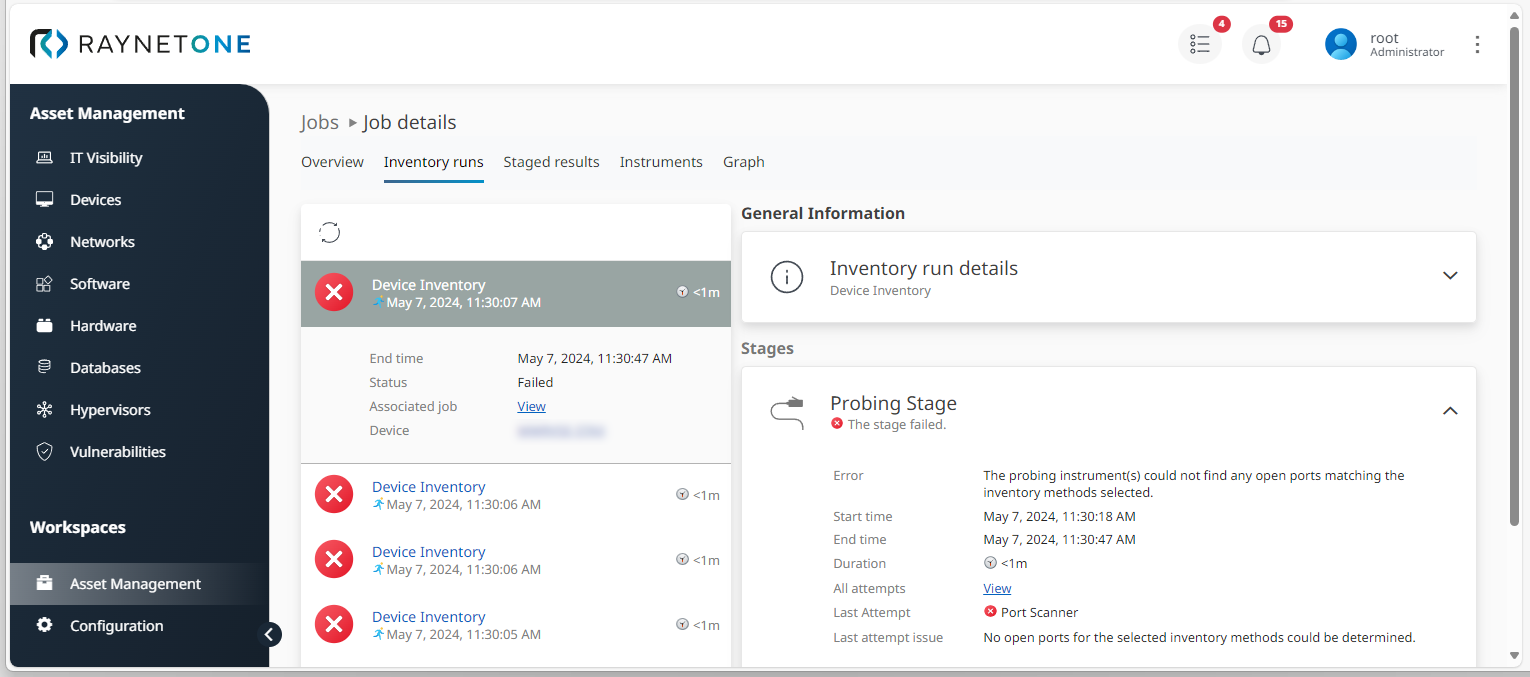
3.Select a list item do dive deeper into its details and get first hints on potential error issues. In this example, the runner faced an issue determining matching open ports. Generally, issues can occur both during the Probing Stage (as shown here) or during the Scanning Stage following up.
4.Get a deeper insight into data results found during the inventory run under Staged results (see definition in chapter Glossary: Decoding Raynet One terminology).
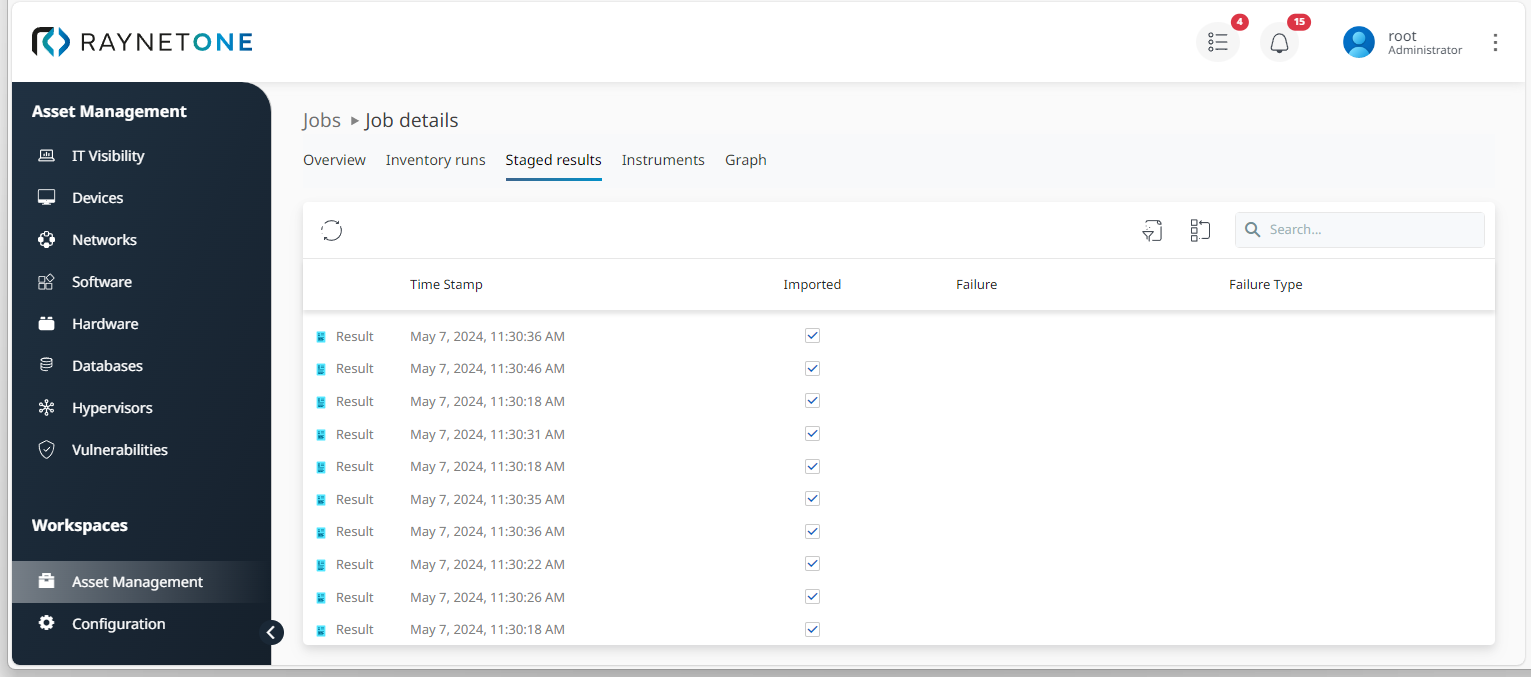
5. Apart from time stamps documenting the time line of the scanning process, you can also view data import results of a job as a Staged result and as a Raw result (code set in a -.JSON format). If necessary. it is also possible to reimport data results.
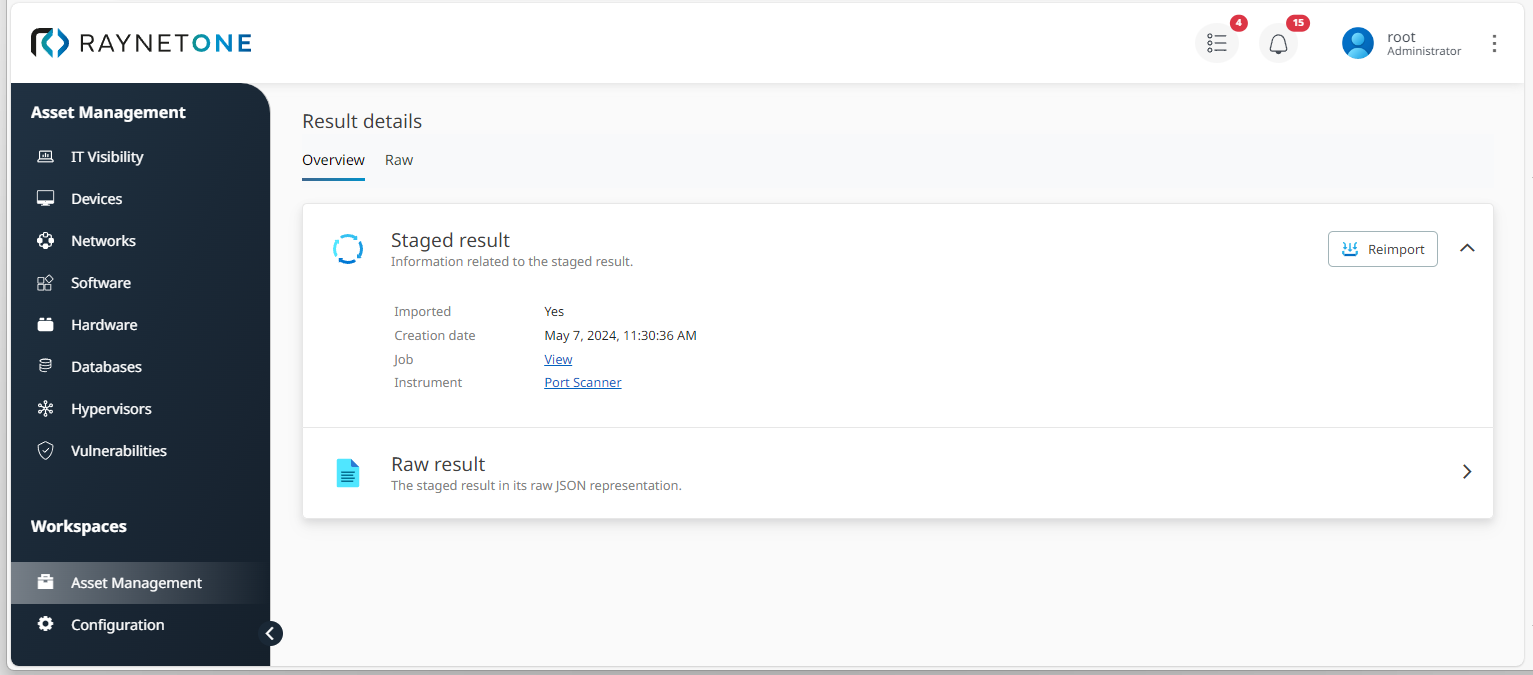
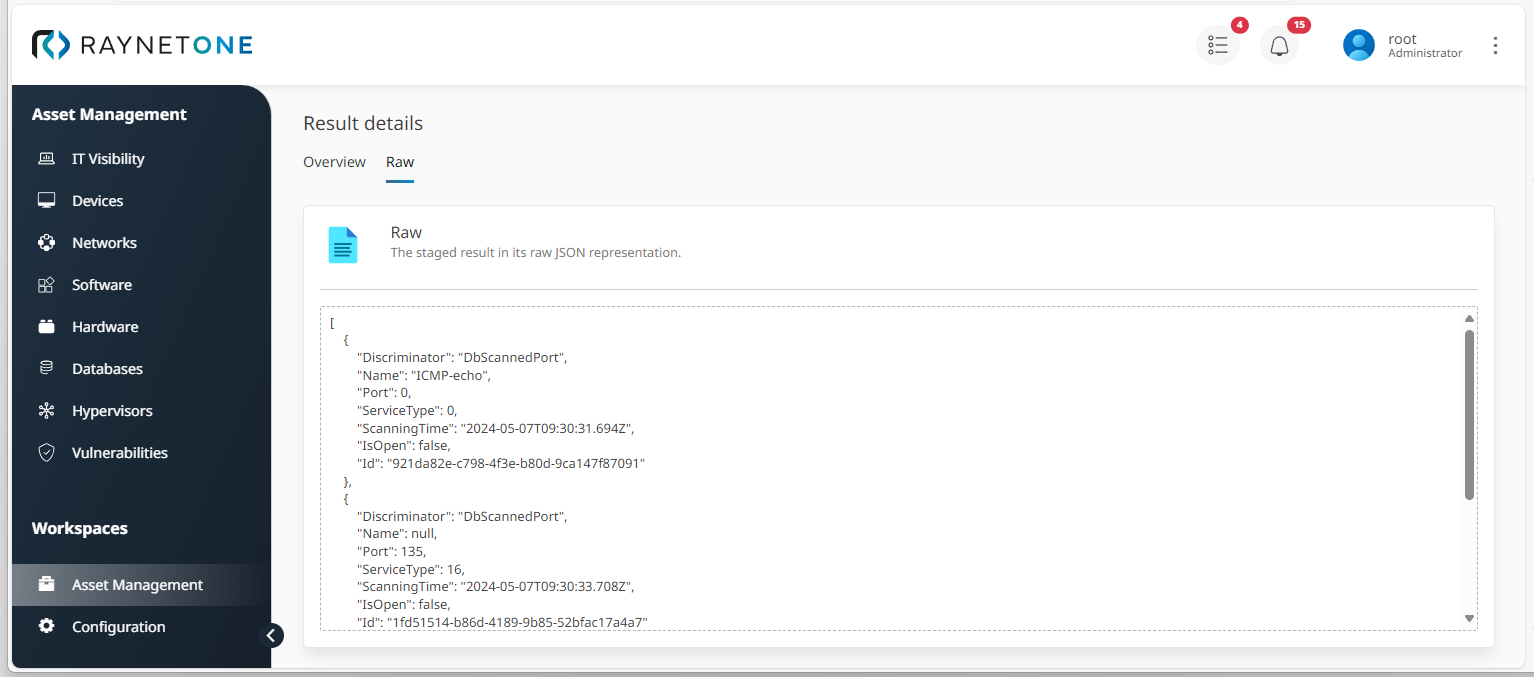
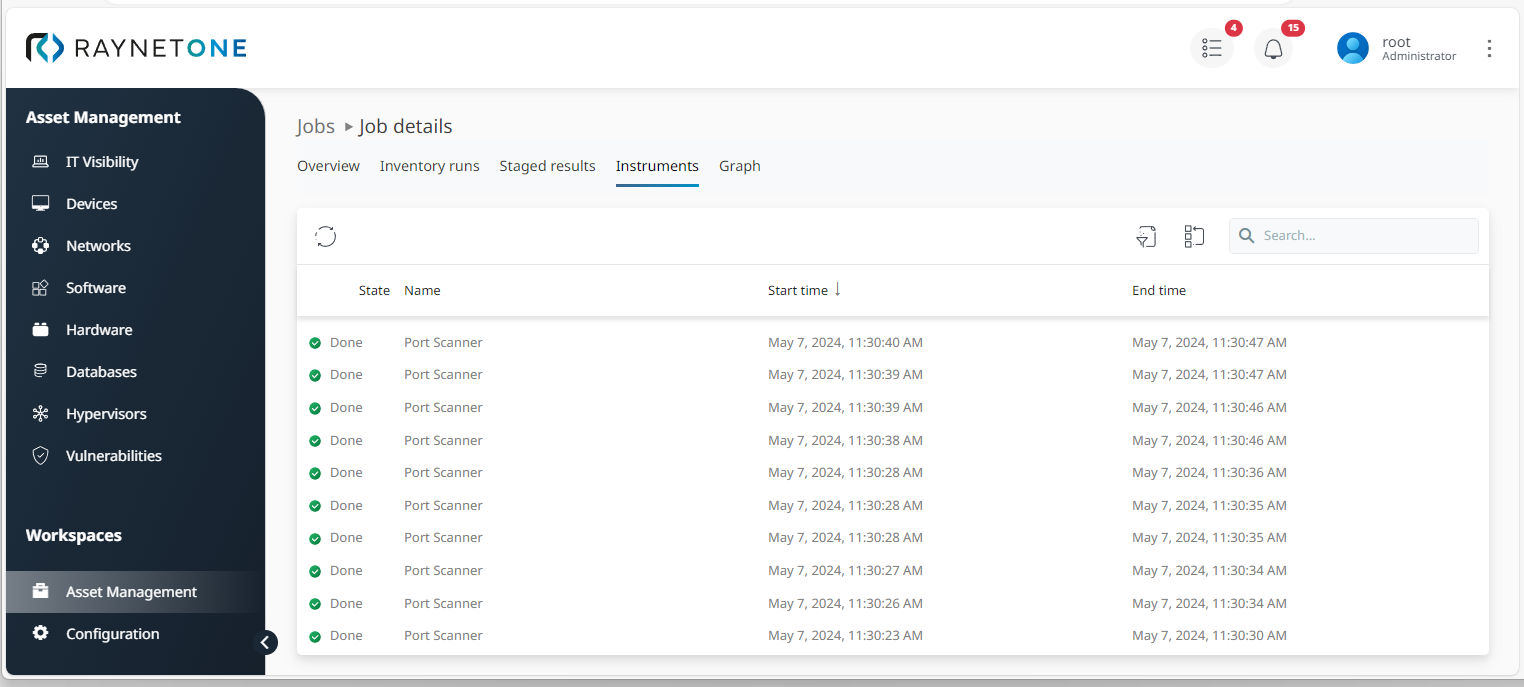
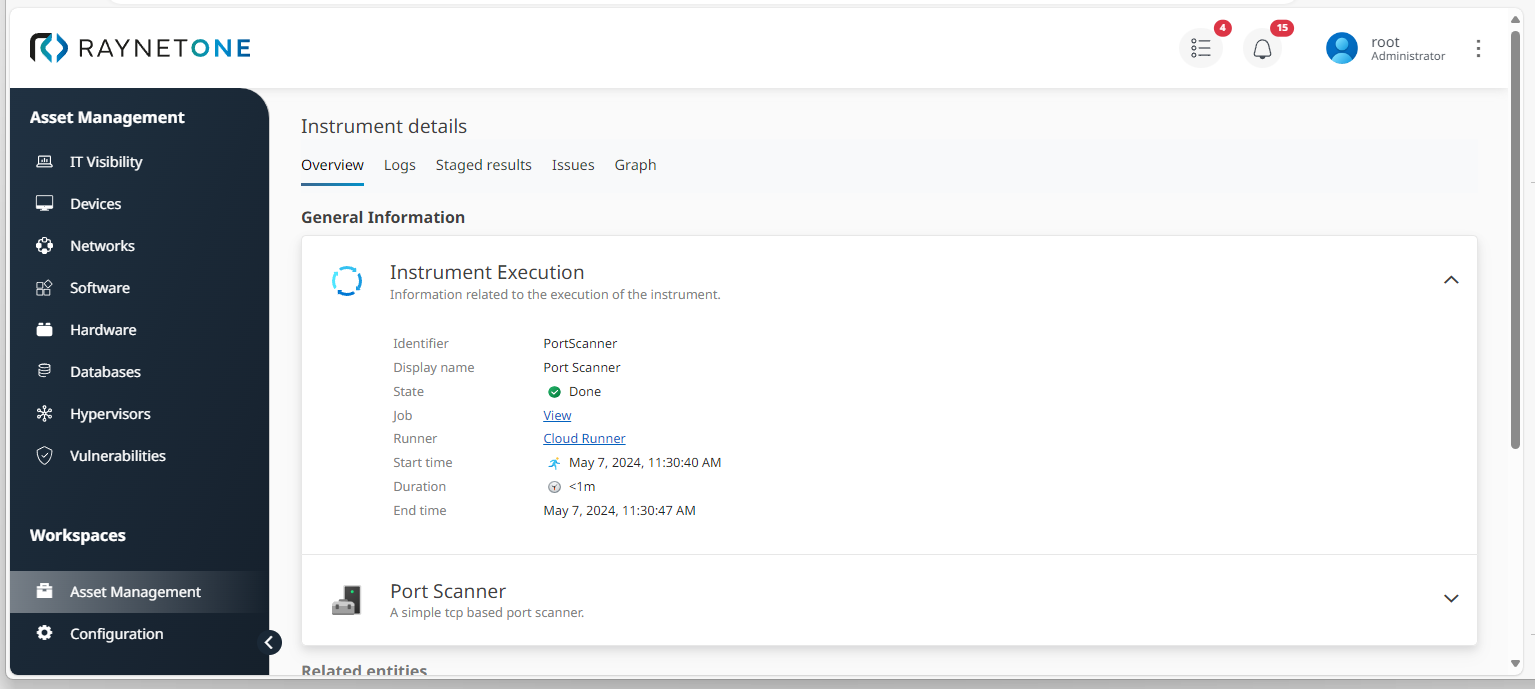
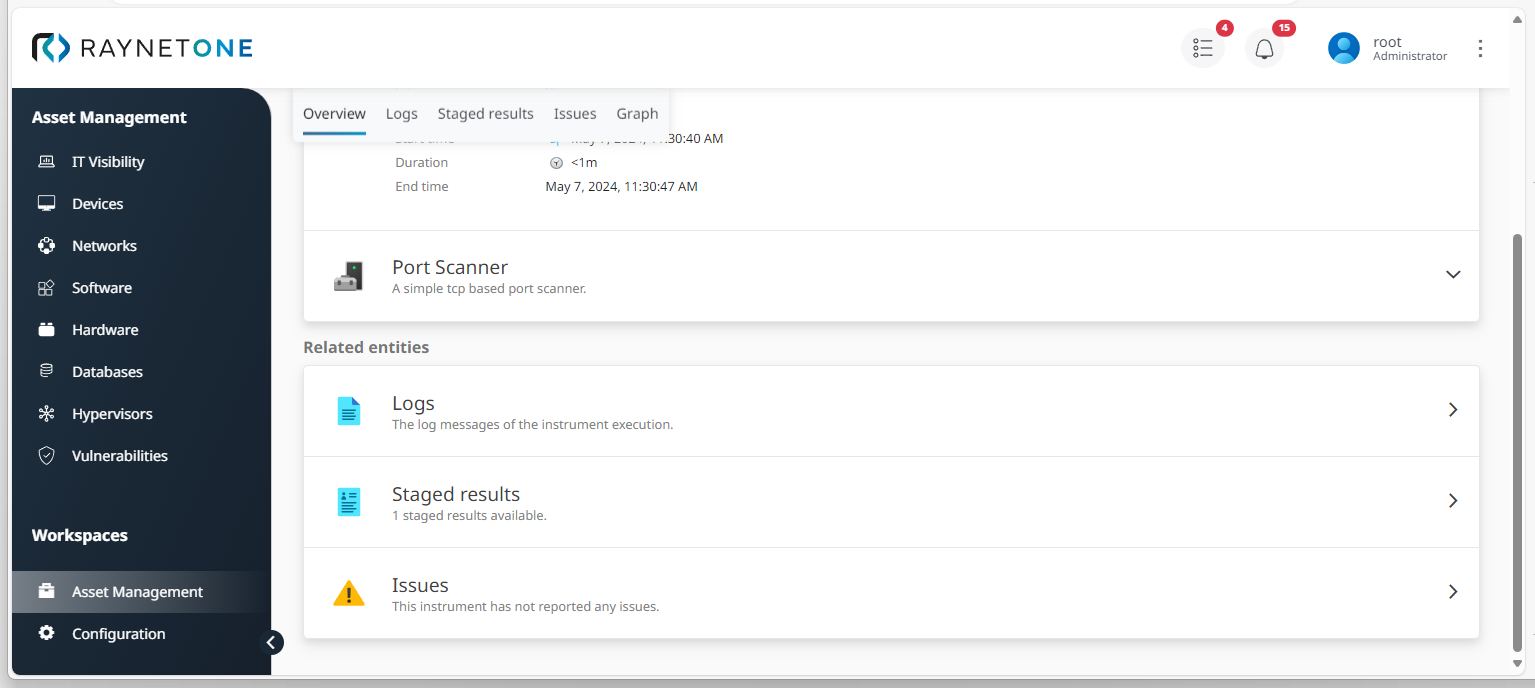
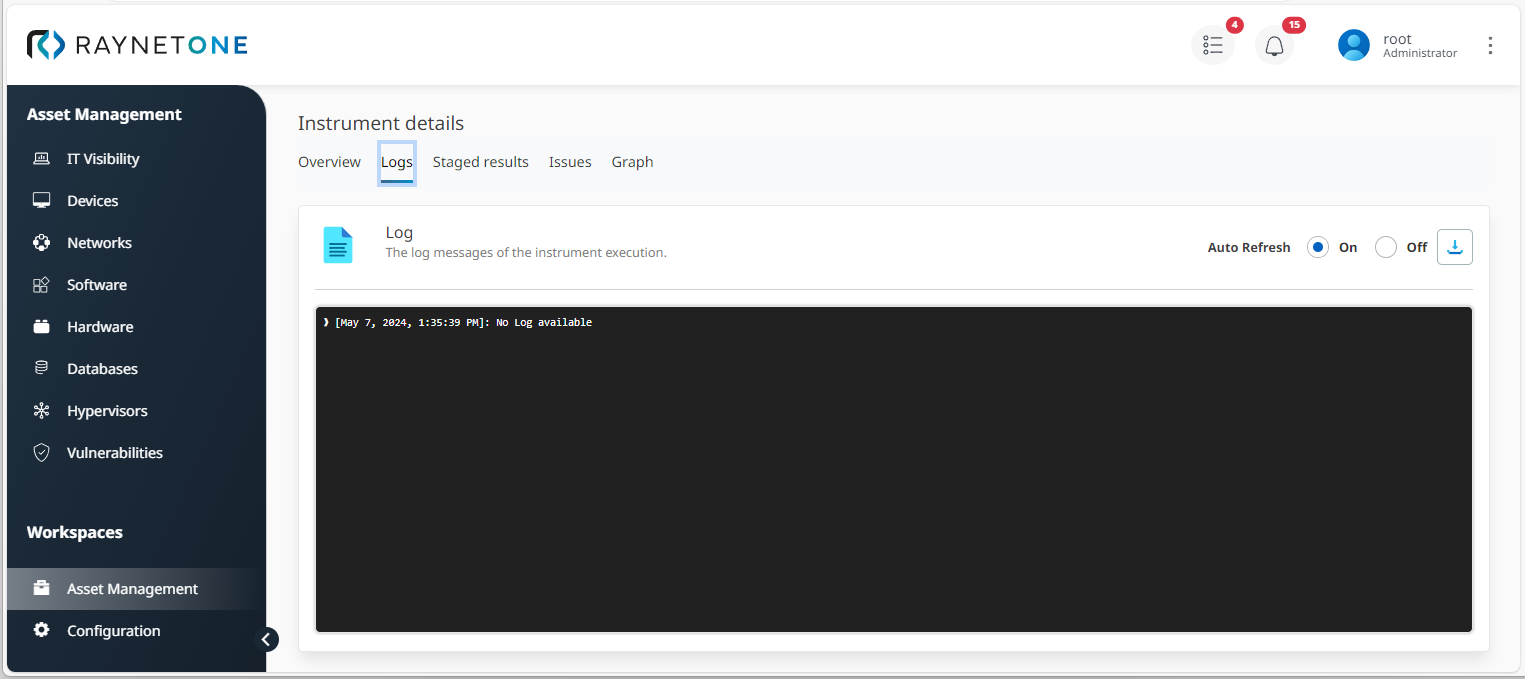
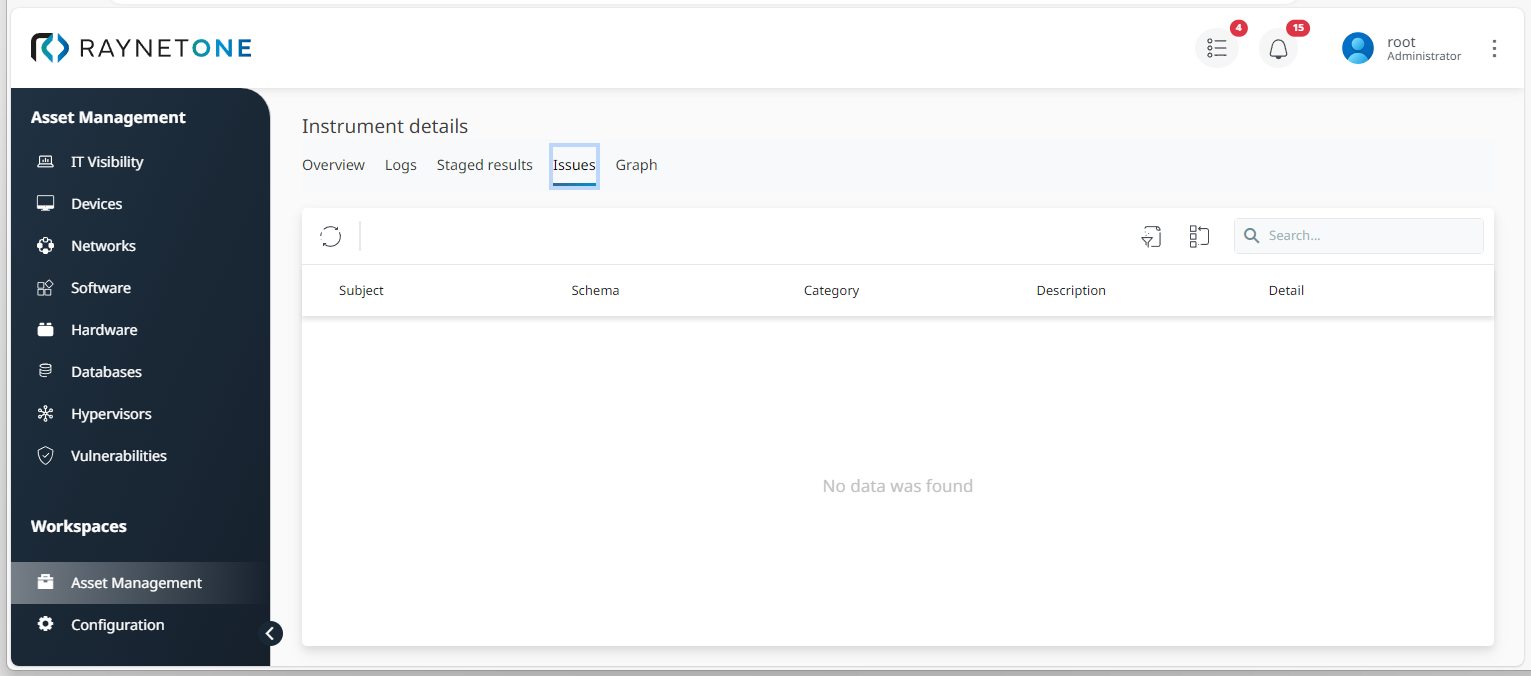
6.Analyze scanning instruments running in the background of the job. Click on a specific instrument to inspect its details and issues. Therefore, you can rely on Logs, Staged results, a list view of Issues (if existent) and a visual process display as a multi-node Graph.
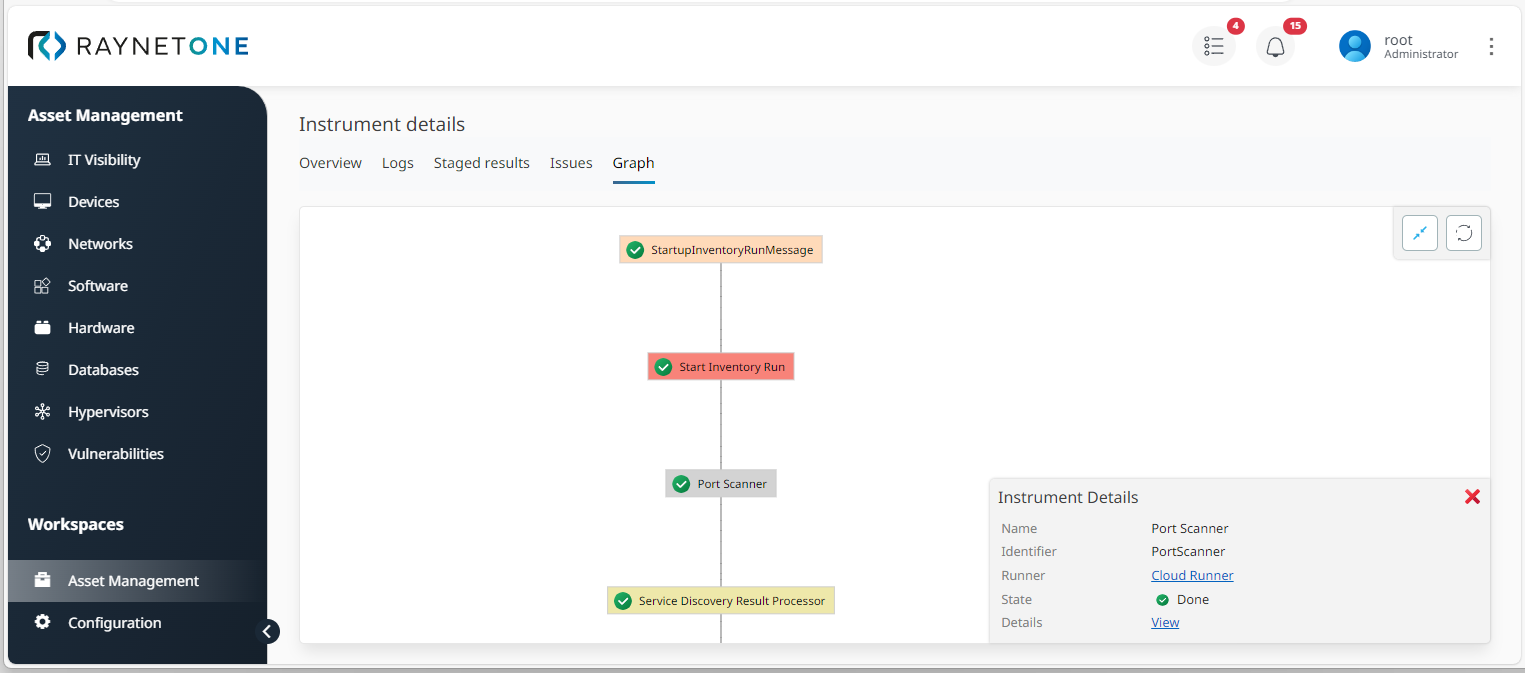
7.In order to track the process of a complete job, also take a closer look at the interactive Graph view which enables you to understand all related processes without reading code files.
|
Tip: |