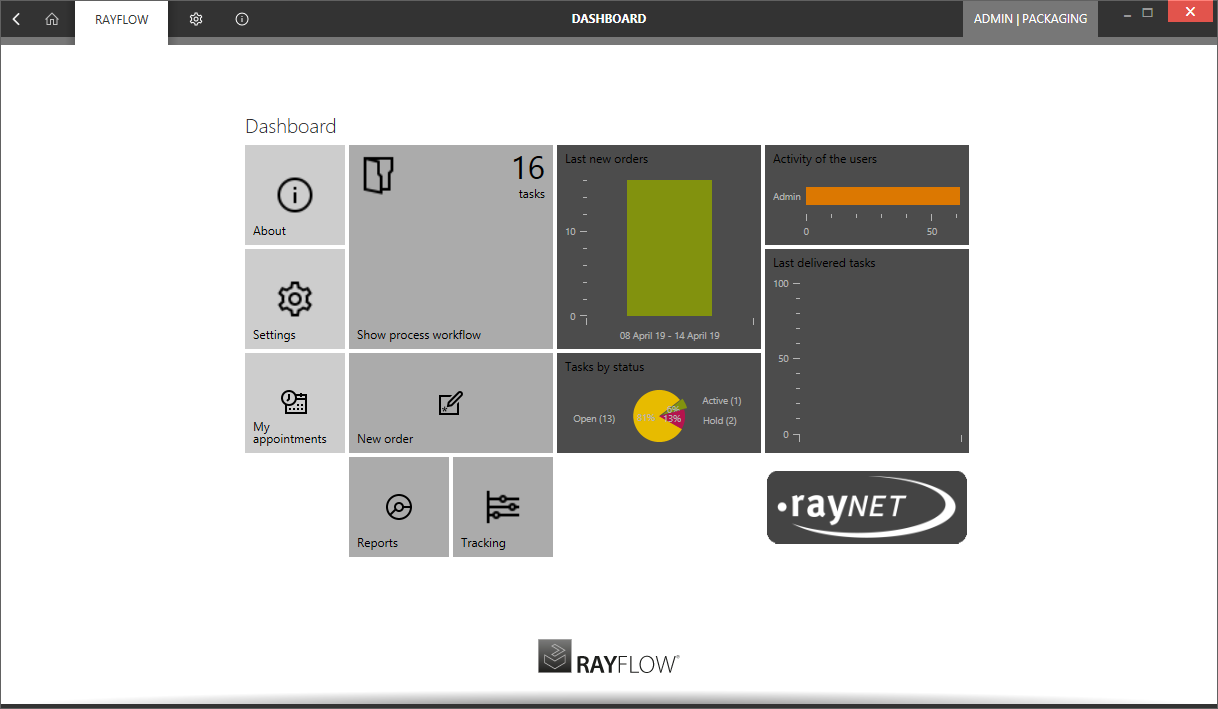
After a user is logged into a project, RayFlow displays a highly interactive, metro-style Home screen. The Home screen consists of the RayFlow dashboard. The dashboard contains XML-based tiles that provide quick launch capability to key functionalities of RayFlow and dynamically updated key figures that are shown as charts within the tiles. Aside from its sleek and agile design the Dashboard is highly customizable and enables the integration of custom data providers. For more information on, how to customize RayFlow client dashboard, refer to the Dashboard Configuration section of this document.
The Dashboard Tiles
Each of the tiles on RayFlow dashboard links to a specific view:
•About: Link to various built-in and online resources is available under the about view
•Settings: Links to the Settings view. This view is also accessible through the main tool bar and apart from specifying the RayFlow server address, it is recommended for users to specify other properties in this view, before starting to work on a project.
•Tracking: When selected, loads the Tracking section in the current view. The Tracking section, helps a user to track the progress of tasks within the workflow
•Reports: Links to the Reports view. This view contains overview of tasks in the workflow and tiles linking to detailed reports
•New order: Loads to package order phase into the view.
•Show process workflow: Loads the Workflow view. This view contains phases along with tiles linking to standalone tools which are configured to be shown under it.
•My appointments: Loads the My Appointments view, showing all the appointments which current user is part of.
•Quick reports: Quick reports shows statistics are raw data plotted over a graph/chart.
