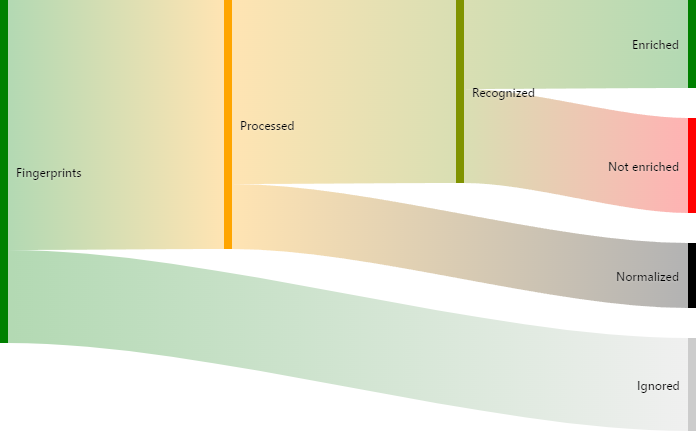
A Sankey diagram is a visual representation used to depict the flow of resources, energy, or any other quantity from one set of elements to another. It is typically represented as a series of interconnected arrows or lines that show the proportional distribution or transformation of these quantities between different components or stages of a system. Sankey diagrams are useful for illustrating complex processes, such as energy or material flows within a system, helping to visualize and analyze resource efficiency, identify bottlenecks, and make informed decisions for optimization and sustainability purposes.

This section consists of the following subsections.
•Providing Data
Describes how to supply the Sankey diagram item with data.
•Layout
Describes layout options of the Sankey diagram item.