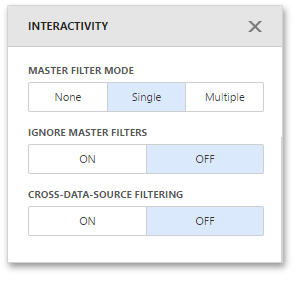
To enable interaction between the Choropleth Map and other dashboard items, you can use the interactivity features. These features include Master Filtering.
Master Filtering
You can use the Choropleth Map dashboard item as a filter for other dashboard items.
The Choropleth Map dashboard item supports filtering by shapes. When Master Filtering is enabled, you can click a shape (or multiple shapes) to make other dashboard items only display data related to the selected shape(s).

To learn more about filtering concepts common to all dashboard items, see the Master Filtering topic.
To enable Master Filtering, go to the Choropleth Map's Interactivity menu and select the required Master Filtering mode.

To reset filtering, use the Clear Master Filter button (the  icon) in the Choropleth Map's caption.