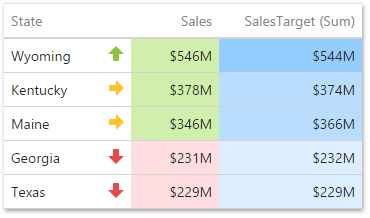
Use conditional formatting to highlight individual cells or rows based on specific conditions. You can apply format rules to the dimension and measure column types. You can use hidden measures to specify a condition used to apply formatting to visible values.

Supported Format Rules
Format rules that can be applied to different data item types are as follows:
•numeric
oValue
oTop-Bottom
oAverage
oExpression
oIcon Ranges
oColor Ranges
oGradient Ranges
oBar
oBar Color Ranges
oBar Gradient Ranges
•string
oValue (with the condition type set to Equal To, Not Equal To or Text that Contains)
oExpression
•date-time
oValue
oA Date Occurring (for dimensions with a continuous date-time group interval)
oExpression
oIcon and Color Ranges
oColor Ranges
oGradient Ranges
oBar
oBar Color Ranges
oBar Gradient Ranges
Refer to the following topic for more information about format condition types: Conditional Formatting in Web Dashboard.
Create and Edit a Format Rule
You can create and edit format rules in the Conditional Formatting section that is located in the following places:
•The dashboard item's Options menu
•The data item menu
Refer to the following topic for information on how to create and edit format rules: Conditional Formatting in Web Dashboard.
Grid-Specific Format Condition Settings
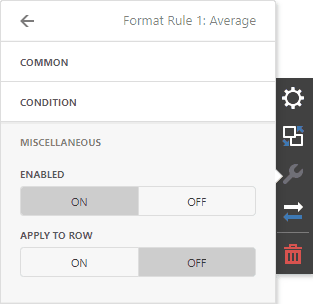
The format rule's Miscellaneous section contains the following properties that are specific to the Grid item:

Option |
Description |
Enabled |
Enables/disables the current format rule. |
Applied to Row |
Applies the current format rule to a row. |