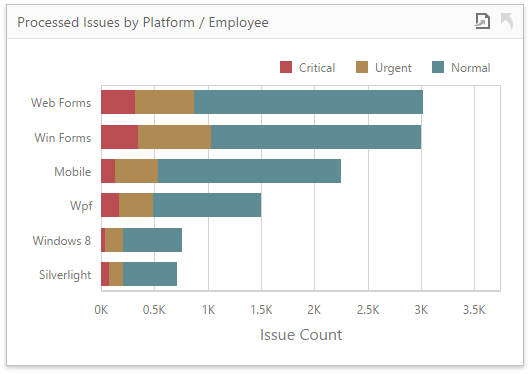
The topics in this section describe the features available in the Chart dashboard item, and provide information on how to create and customize charts in the Web Dashboard.

This section is divided into the following subsections.
•Providing Data
Explains how to supply the Chart dashboard item with data.
•Series
Enumerates and describes different types of series that can be displayed within the Chart dashboard item.
•Panes
Introduces the concept of chart panes (visual areas within a diagram that display chart series), and describes how to create them.
•Interactivity
Describes features that enable interaction between the Chart and other dashboard items.
•Legend
Provides information about the chart legend and its options.
•Axes
Describes how to customize settings related to chart axes.
•Orientation
Describes how to toggle the chart's orientation.
•Conditional Formatting
Describes the format condition settings.