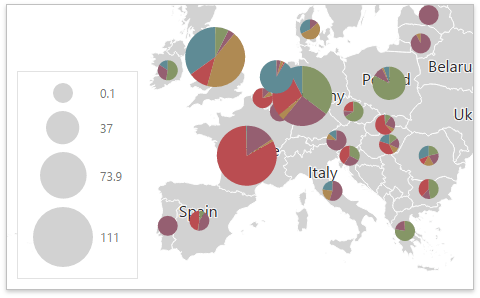
The Pie Map dashboard item allows you to display pies on the map. Each pie visualizes the contribution of each value to the total.
Topics in this section describe specific capabilities of the Pie Map dashboard item.
•Providing Data
Describes how to supply the Pie Map with data.
•Pie Options
Describes the specific options of the Pie Map dashboard item.
•Coloring
Describes the capability to manage coloring of the Pie Map.
•Legends
Describes the available Pie Map legends and their options.