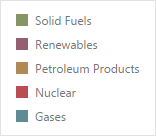
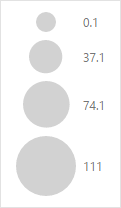
The Pie Map provides two types of legends used to identify map objects - color and weighted legends.
Color Legend
The color legend helps you identify which colors correspond to specific argument values.

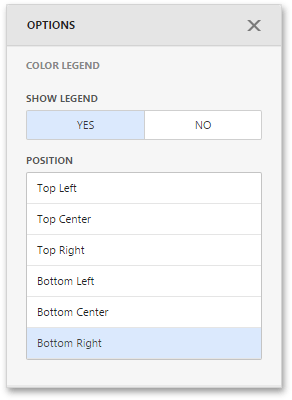
To specify color legend settings, go to the Color Legend section of the Pie Map's Options menu.

Here you can show or hide the color legend and change its position.
Weighted Legend
The weighted legend allows you to identify values corresponding to specific pie sizes.

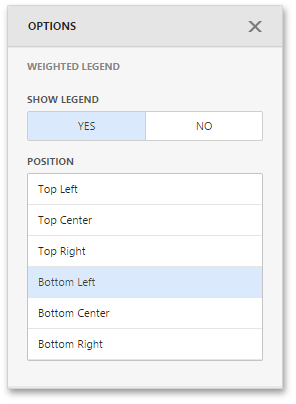
To specify weighted legend's settings, go to the Weighted Legend section of the Pie Map's Options menu.

Here you can show or hide the weighted legend and change its position.