The Chart dashboard item displays two axes by default: the X-axis and the Y-axis. The X-axis is the axis of arguments and the Y-axis is the numerical axis of values.
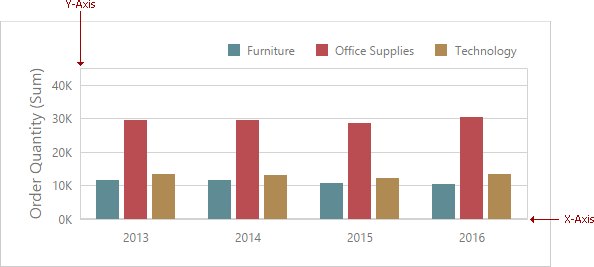
Axis X
To access X-axis settings, go to the Chart's Options menu and open the Axis X section.
You can configure the following settings.
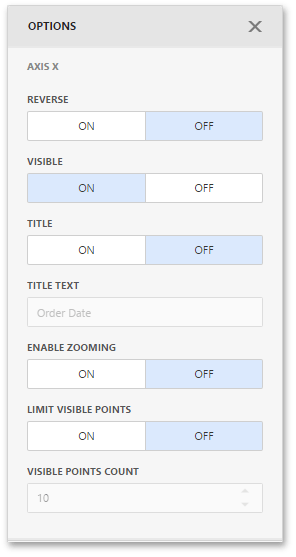
•The Reverse option allows you to reverse an X axis. If the X axis is reversed, its values are ordered from right to left.
•The Visible option specifies whether the axis is visible.
•The Title option specifies the X axis's title. Use the Title Text field to set the title.
•The Enable Zooming option allows you to enable zooming for the X axis.
•The Limit Visible Points option allows you to limit the number of visible points. The Visible Points Count field allows you to specify the maximum number of visible points.
Continuous and Discrete X-Axes
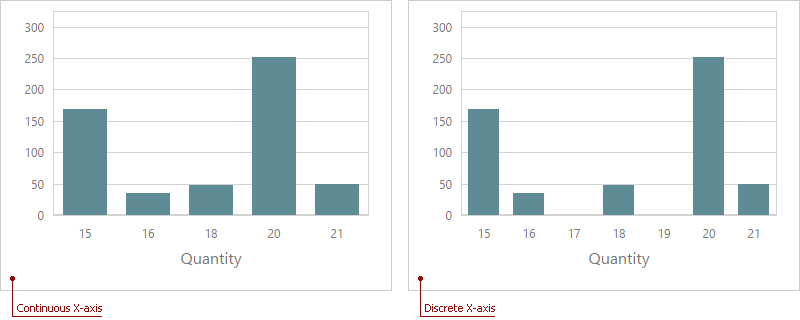
If the dimension in the Arguments section contains numeric data, the Chart can create either a continuous X-axis or a discrete X-axis.
If a continuous axis is used, the distance between argument values is proportional to their values. On a discrete axis, all argument values are an equal distance from each other.
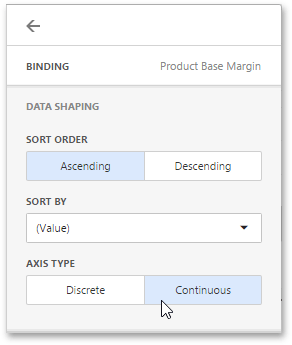
To specify the X-axis type in the Web Dashboard, go to the data item Data Shaping menu for the argument dimension and select the axis type. The image below illustrates how to change this setting for the Product Base Margin data item.
Axis Y
To access Y-axis settings, go to the Chart's Options menu and open the Axis Y section for a corresponding pane.
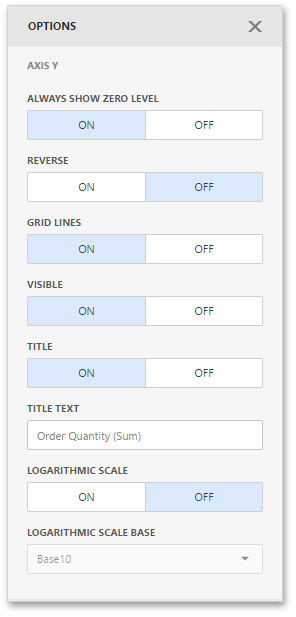
•The Always Show Zero Level option allows you to indicate whether or not an axis zero value should be displayed.
•The Reverse option allows you to reverse an Y-axis. If the Y-axis is reversed, its values are ordered from right to left.
•The Grid Lines options allows you to control the visibility of the reference lines used to improve the readability of a chart's visual data.
•The Visible option specifies whether the axis is visible.
•The Title option specifies the Y-axis's title. Use the Title Text field to set the title.
•The Logarithmic Scale option allows you to use a log scale to display Y-axis. Use the Logarithmic Scale Base field to set a log scale base.
Secondary Axis
The secondary Y-axis is useful when it is necessary to visually combine several charts into one. Secondary axes provide the ability to plot series with different ranges on the same chart.
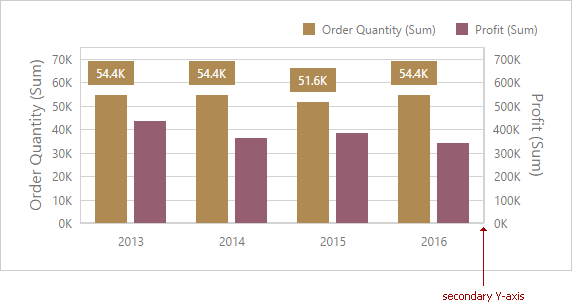
To plot the required series using the secondary axis, go to the data item Options menu for the value measure and turn the Plot on Secondary Axis option on.