There are some different techniques for debugging and troubleshooting ETL.
Verbose output
By default, only some basic information and success/failure messages are logged in the console window. To activate a more verbose output, add --verbose true switch to your command line. Verbose mode is activated automatically if any of --debug or --break command line switch is used.
In verbose mode, the following features are activated
•More verbose messages
More info is logged in the console. Additional information include: duration of operations, files being used (database file, SQL scripts)
•Data
First three rows of each table output are printed into the console, so that the user can control the execution state.
•Colum types
Column types for tables written back to the DB (load phase) are written into the console output.
Debug mode
Debug mode disabled some optimizations. To use it, add --debug true to your command line. Debug mode automatically activated verbose output. The following features are activated in the debug mode:
•Disabled flow optimizations
Without the debug mode, ETL tries to organize the steps in batches and executes up to 10 steps in parallel, ensuring that the dependencies are fulfilled. In the debug mode, the steps are ordered to fulfill the dependencies and requirements, but are always started sequentially. This means that the execution takes more time, but gives the user a way to control the execution and state after each step.
•Limited parallelization
Some operations are executed sequentially and not in parallel.
•Disabled tree-shaking
All steps will be invoked, even these that do not produce external tables.
•All features introduced by verbose mode.
Breakpoints
Breakpoints are meant to pause the execution after each step. The execution is only continued once the user presses any key. Breakpoints automatically enable verbose output and debug mode. To activate the breakpoints, add --break true to your command line. The following features are activated in the breakpoint mode:
•Breakpoints
After each step, a breakpoint is triggered. The execution continues to the next step only after pressing any key. Again, this gives the user some time to check the current step of the database and the transformed data.
•All features introduced by debug mode.
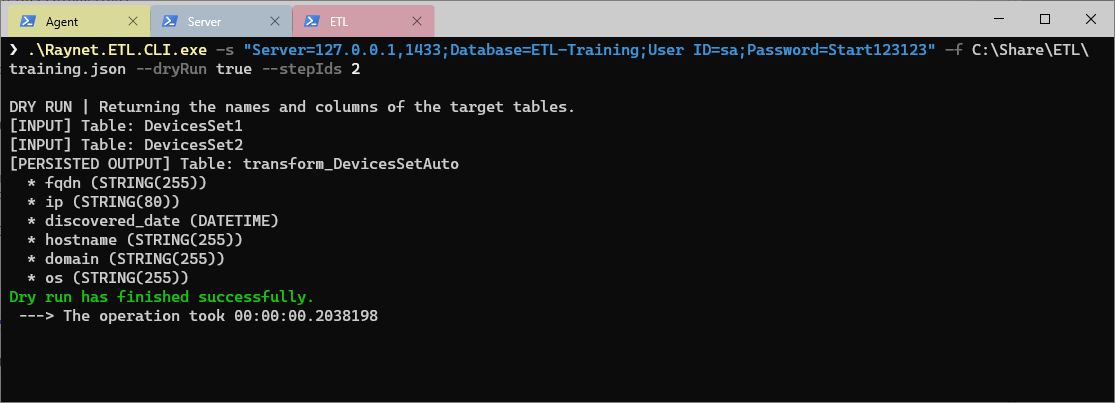
Dry mode
Dry mode enables you to see which tables are required and produced by a given JSON file, without actually doing the transformation. This process is fast as only minimal set of metadata gets pulled from the database. To activate dry mode, add --dryMode true to the command line. If the switch is present, you can also use another parameter --stepIds which may contain space-separated list of step identifiers to be analyzed. If no step ID is provided, then all steps from the selected JSON file will be analyzed.
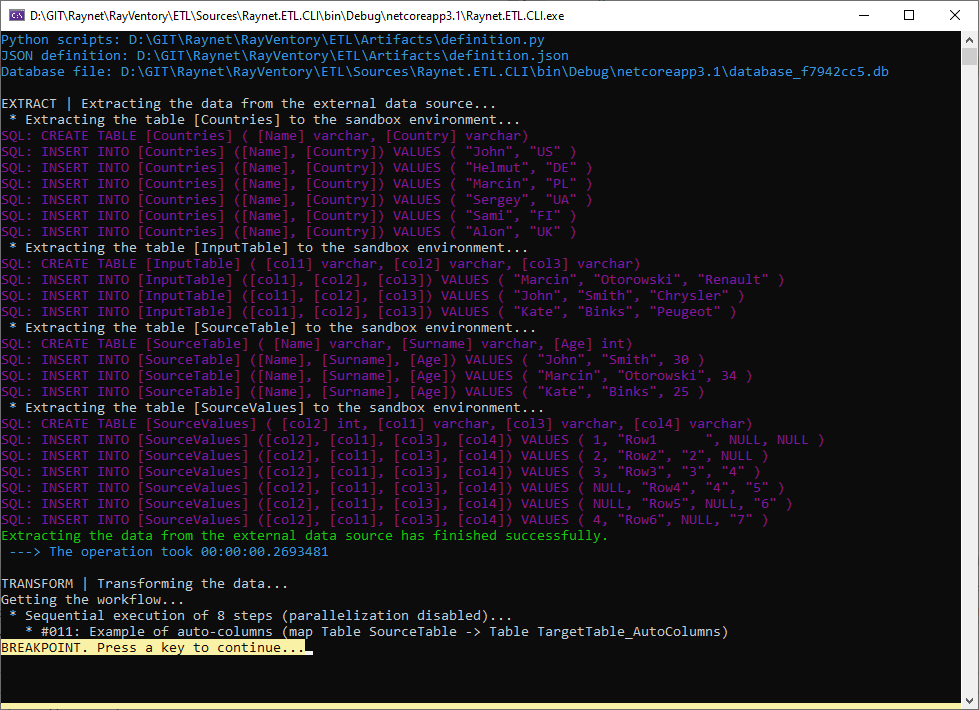
Sample output
Sample output from the console when all three switches are used:
Example of dry mode: