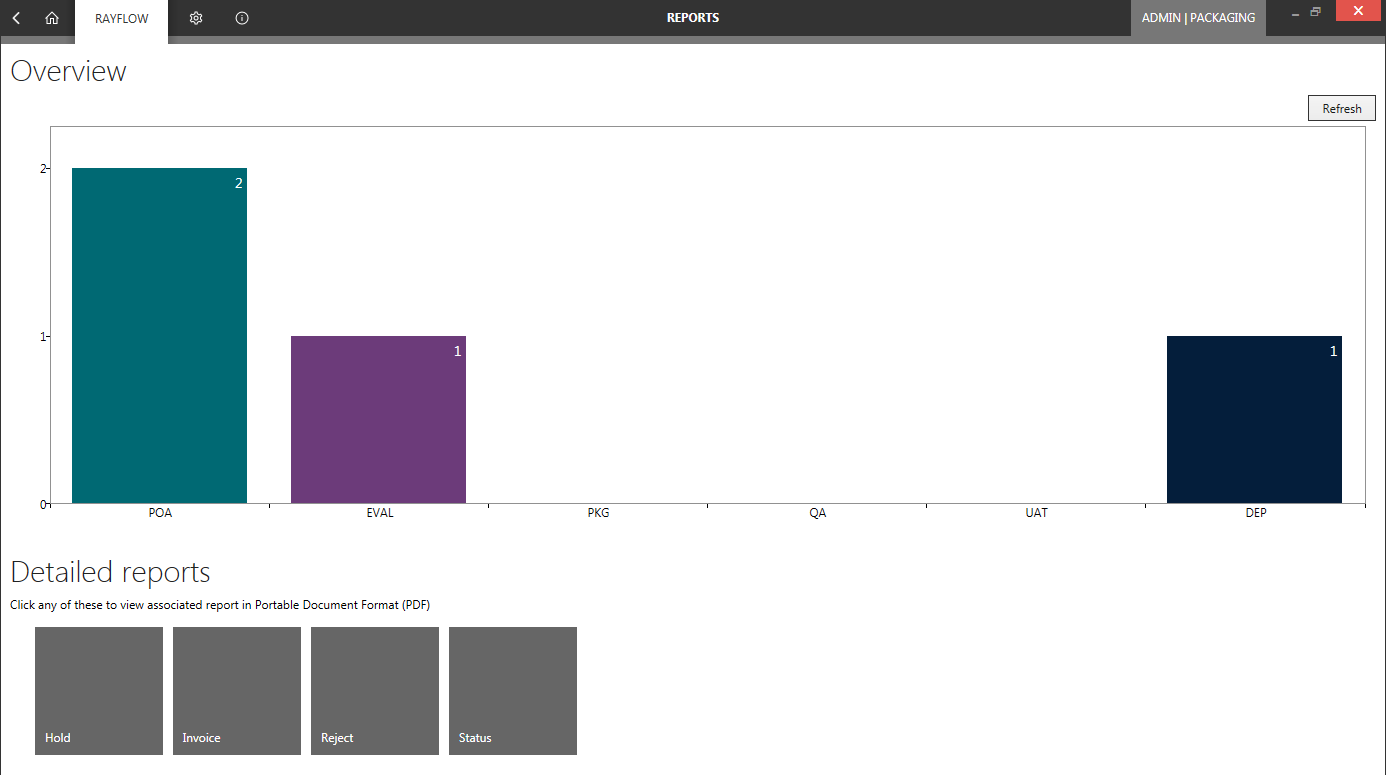
The Reports window of the RayFlow client provides a formal account of the task’s status and progress over the phases in workflow. This window is further divided into two sections: OVERVIEW and DETAILED REPORTS.
Overview Reports
Overview section uses bar chart to show the number of tasks that are currently active in different phases. The bar chart on its horizontal axis shows the phases name and on its vertical axis show numbers, against which the graph is plotted. In addition, each bar representing the number of tasks in a phase, show that number in the top-right corner or when the mouse if hovered above them.
Within the phase configuration section of RayFlow Web Interface, a user can set the color codes for the bars representing different phases. Furthermore, the Overview section comes with a REFRESH button which when clicked upon, updates the chart with current statistics from the server.

Detailed Reports
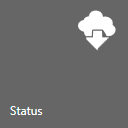
The Detailed reports section, contain reports in PDF format. A user can add or remove crystal/SSSRS reports via the Reports page of RayFlow web client. A user directly can access these reports via the RayFlow client in .pdf format. Additionally, when a user hovers mouse over each of the report tiles, a download icon is displayed. Clicking on the icon will download the report to the selected location.

Depending upon the information source and criteria specified while creating the reports, it can provide its users a wide range of useful information related to the project.